
Sample Category Title
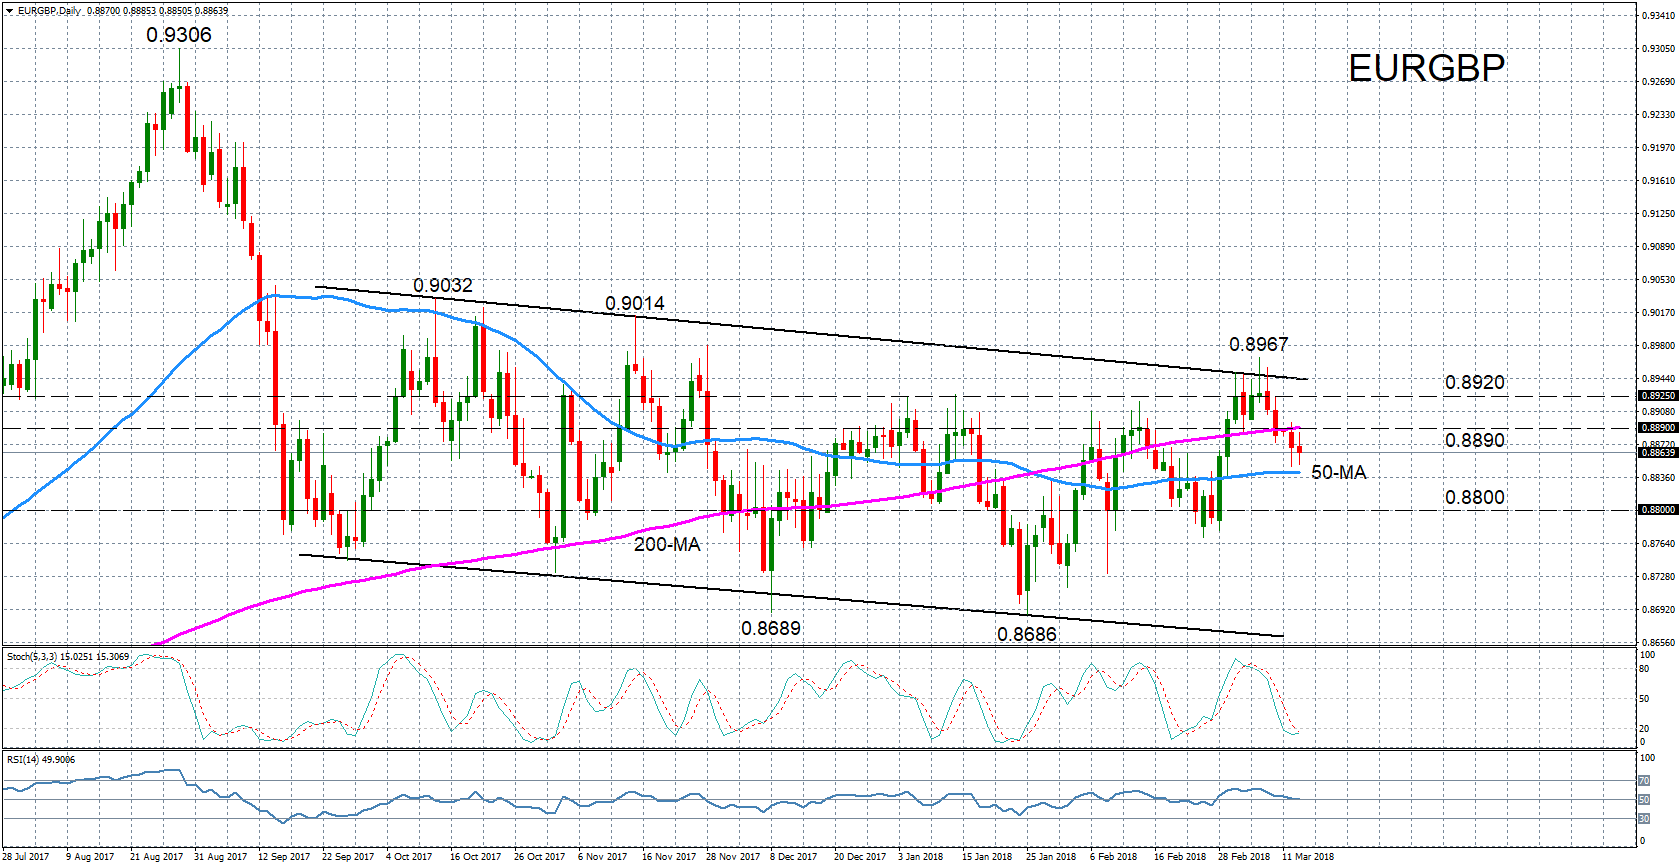
EURGBP Still Consolidating; Unable to Break above Upper Channel
EURGBP has been consolidating since September 2017 and has been stuck in a channel tilted slightly to the downside. The neutral to bearish picture in the medium term looks to last for a while longer after prices failed to break above the upper channel earlier this month.
Resistance was met at around the 0.8950 region after prices hit a 3-month high of 0.8967, forcing the pair to reverse lower. The negative bias in the near term is supported by the deterioration in the momentum indicators. The %K line of the stochastic oscillator has fallen sharply into oversold levels and is attempting a bullish crossover with the %D line. However, the RSI is flatlining at the 50-neutral level, suggesting any upside correction will be weak.
If prices continue to head lower, support should come from the 50-day moving average (MA) near the 0.8840 mark. A drop below the 50-day MA would reinforce the short-term bearish view and open the way towards the 0.88 level, which has been a major support area in the past.
However, should an upside reversal take form, immediate resistance will likely come from the 200-day MA around 0.8890. A break above the 0.8890 level could shift the bias back to a bullish one, with the next resistance coming from the 0.8920 level before re-challenging the March high of 0.8967.
US 100 Index Hits Fresh Record High; Looking Bullish in the Medium-Term
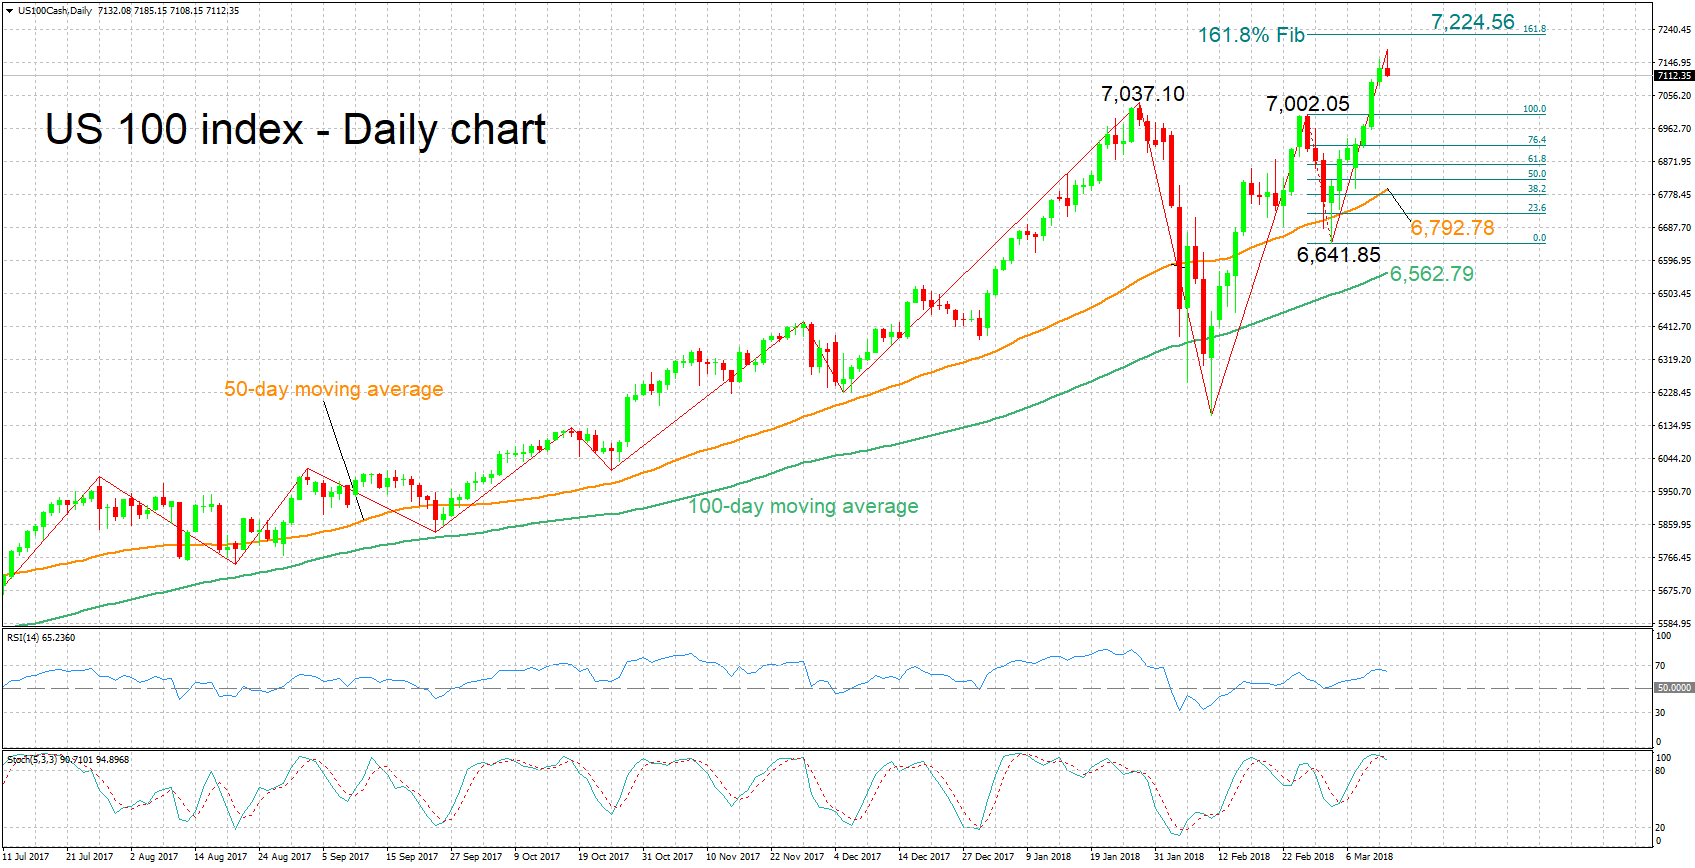
The US 100 index has advanced considerably, managing to finish higher in the seven preceding trading days after recording a one-month low of 6,641.85 on March 2. Earlier on Tuesday, it hit a fresh all-time high of 7,185.15.
The RSI has been rising lately, projecting a bullish picture in the short-term. However – and turning to the stochastics – the %K line has just crossed below the slow %D line. This might constitute an early indication for declines in the very short-term.
Further advancing could meet resistance around the 161.8% Fibonacci extension level of the February 27 to March 2 downleg at 7,224.56. The 7,200 handle that may hold psychological importance is also part of the area around this level.
On the downside, support might come around 7,037.10, this being a previous top with the range around it also encapsulating the 7,000 handle – another potential psychological level – as well as another peak from the past at 7,002.05.
The medium-term picture is looking bullish, with price action taking place above the 50- and 100-day moving average lines, and both lines maintaining a positive slope.
Overall, both the short- and medium-term outlooks are looking positive, with a bearish signal though currently in place in the very short-term.
Pound Gains Ground, Heading to 1.40
The British pound has posted gains in the Tuesday session. In North American trade, GBP/USD is trading at 1.3981, up 0.50% on the day. The pound is closing on the symbolic 1.40 level, and is at a 2-week high. In economic news, the sole British release is the annual budget. In the US, CPI and Core CPI both slowed to 0.2%. On Wednesday, the US releases key inflation and consumer spending reports.
The markets are keeping a close eye on the Federal Reserve, which holds its next policy meeting next week. The Fed is widely expected to raise rates for the first time this year, but the real question is how many hikes we’ll see in 2018. The Fed projection remains at three rate hikes, but strong economic data, especially from inflation indicators, could push the Fed to raise its forecast. Higher US interest rates makes the greenback more attractive to investors, so the number of rate hikes could have a strong impact on the currency markets.
Are Britain and the European Union heading towards a showdown? Last week, Donald Tusk, president of the European Council, advised Prime Minister May to “pink’ her red lines on Brexit, if Britain wants to maintain a close economic relationship with the bloc. May has insisted that there will be no customs union, and the European Court of Justice will have no jurisdiction over the UK. May set out these positions after the EU published its draft negotiating guidelines for Brexit, and the guidelines warned of “negative economic consequences” if Britain does not soften its position. Tusk added that he does not want to build a wall with Britain, and the EU could offer Britain a free trade agreement, with zero tariffs. At the same time, Tusk warned that Brexit will make trade between the two sides “complicated and costly” and the EU would not allow Britain to cherry pick in any future trade arrangement. EU members are expected to sign off on the negotiating guidelines at a summit in late March, which could trigger a nasty response from the May government.
Japanese Yen Slips to 2-Week Low, BoJ Minutes Next
The Japanese has edged lower to start the week. In North American trade, USD/JPY is trading at 106.86, up 0.42% on the day. In Japan, PPI edged lower to 2.5%, matching the estimate. Tertiary Industry Activity declined for a second straight month, with a reading of -0.6%. This was weaker than the estimate of -0.2%. Later in the day, we’ll get a look at Core Machinery Orders and the BoJ Minutes from the January meeting. In the US, CPI and Core CPI both slowed to 0.2%. On Wednesday, the US releases key inflation and consumer spending reports.
Inflation indicators have softened in both the US and Japan. In the US, CPI dropped from 0.5% to 0.2%, and Core CPI edged lower to 0.2%, down from 0.3%. In Japan, the Producer Price Index dropped for a third straight month in February. Lower inflation could have a significant impact on monetary policy in both Japan and the US. The Bank of Japan has consistently said that it will not reduce its stimulus program until inflation moves higher, while in the US, if inflation does not move upwards, the Fed could maintain its projection of three rate hikes in 2018. If inflation does increase, there is a stronger likelihood of four rate hikes this year.
The markets are keeping an eye on the BoJ minutes from the January meeting, which could provide some clues as to future monetary policy. There have been some mixed messages from the Bank, which made no changes in interest rate levels at last week’s policy meeting. The Bank sounded optimistic about economic growth, which has been moderate but steady, thanks to a strong export sector. However, BoJ Governor Haruhiko Kuroda was decidedly dovish in his remarks, saying that the BoJ would consider further easing if inflation did not reach the bank’s target of around 2% by 2020. These comments mark a 180-degree turn from remarks just a week earlier, in which Kuroda talked about the possibility of an exit from stimulus, which sent the yen upwards.
Trump Tariffs Traumatize Trade Talks
Highlights
- President Trump last week imposed tariffs on imported steel and aluminum, largely in accordance with the findings of two Commerce Department reports. The tariffs will be initially set at 25% for steel and 10% for aluminum, with the goal of increasing and maintaining domestic industry’s capacity utilization around 80%.
- Canada and Mexico have been excluded from the tariffs, but the continued carve-out is conditional on the successful renegotiation of NAFTA. Other countries will also be able to apply for exemptions from the tariffs. As further exemptions are added, the rate on the tariffs will likely rise.
- Imposing the proposed tariffs will lead to a sharp increase in U.S. steel and aluminum prices which will pass-through and lift CPI inflation by about 0.1pp. The tariffs will also result in lower imports -- helping narrow the U.S. trade deficit. Domestic production will compensate, increasing by over 10%, and adding some 5,000 to 10,000 jobs as a result. However, the higher prices will hurt metal-intensive manufacturers in the U.S. including fabricated metals, machinery, and transport equipment, where 25,000 to 50,000 jobs could be lost vis-a-vis business-as-usual levels.
- In the case of Canada, assuming the exemption holds should lead to a modest upside for the Canadian steel and aluminum making industry, with output expected to rise by more than 10%, as some 1,500 new jobs are created. Still, the additional demand isn’t likely to lead to a surge in investment, particularly amidst existing uncertainty. A loss of the exemption should be unequivocally bad for the economy.
- The current situation remains fluid as countries are weighing their chances of exemptions and in some cases readying possible retaliatory measures. While we cannot rule out a trade war, such a scenario remains quite unlikely at this point in time, with retaliatory responses expected to be measured, as cooler heads prevail.
Chart 1: Trump Tariffs Target 80% CAPU
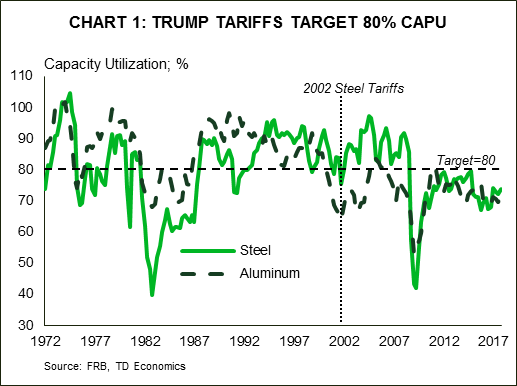 At the stroke of a pen on March 8th 2018, President Trump imposed tariffs on imported steel and aluminum, marking another significant step toward “America First” protectionism. The Presidential Proclamation largely follows the recommendations from two Commerce Department reports carried out under Section 232 of the Trade Expansion Act of 1962. These reportsi, presented to the President on January 11th and made public on February 16th, found that the present quantities and circumstances of steel and aluminum imports are “weakening our internal economy” and “threaten to impair the national security.” As a result, Commerce Secretary Ross recommended the President take immediate action, setting quotas or tariffs sufficient enough to enable domestic producers to operate at a capacity of at least 80% (Chart 1), even after any exceptions should they be granted. According to the reports, raising utilization rates from their current levels would require steel and aluminum imports to decline by 37% and 13% – achieved by setting blanket tariffs of 24% and 7.7%, respectively.
The President decided to impose a tariff of 25% on steel and 10% on aluminum, with the modestly higher rates offsetting the carve-outs for America’s NAFTA partners. Importantly, the exemptions for Canada and Mexico are conditional on a successful renegotiation of NAFTA, and will likely be used as bargaining chips. The Proclamation document itself embeds significant flexibility, enabling the President to implement further carve-outs and raise rates commensurately in order to keep imports and domestic capacity utilization at the desired level. At the extreme, exempting all but the 12 lowest cost exporters outlined in the report – including Brazil, South Korea, Russia, China, etc.ii – requires the tariff rate on steel be more than doubled to 53%. The same goes for aluminum, with a tariff of 23.6% necessary should it be levied only on the five countries highlighted in the report – China, Hong Kong, Russia, Venezuela, and Vietnamiii – as having significant overcapacity, lacking reliability, or engaging in transshipments from China to evade existing anti-dumping and countervailing duties. China, Russia and Vietnam were the only countries of the fourteen highlighted by the reports found on both lists, but the President’s veiled threat that the bilateral trade deficit will be cut “one way or another” was squarely targeted at China.
Chart 2: Aircraft, Soybeans, Autos, and Electronics At Risk of Retaliation
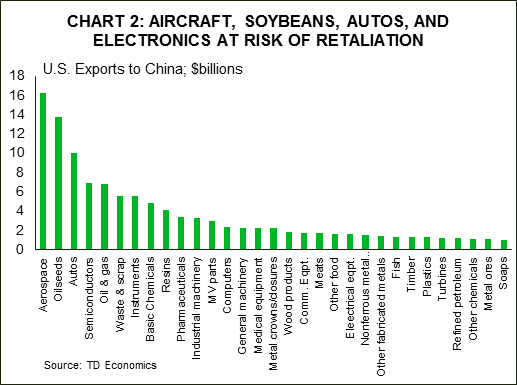 While some countries, like Australia and the EU, are sure to apply for exemptions, the key offenders noted in the administration’s report may instead pursue retaliatory measures, even if only symbolic. Farm products appear to be the most likely choice for China due to their sheer volume and outsized political influence of farm states. Retaliatory measures could range from the relatively lenient, focusing on sorghum (KS, TX, AR, and NE), to the highly-punitive levied on soybeans (IL, IN, IA, MN, and NE). Already, China has pre-emptively tightened impurity limits on soybean shipmentsiv and launched an investigation into U.S. sorghum exportsv as warning shots. Aerospace and automotive industries are also at risk from China’s potential retaliation (Chart 2). On the other hand, countries that lack the scale, such as Vietnam or Venezuela, will likely focus even more on political pain points, with bourbon (KY, home state of Senate Majority Leader Mitch McConnell), cranberries (WI; home state of House Speaker of the House Paul Ryan), orange juice (FL), and peanut butter (GA). Iconic American brands selling motorcycles and jeans are also at a high risk. Lastly, steel and aluminum itself are themselves obvious choices.
In this report, we assess potential economic consequences of this trade action on the U.S. and Canadian economies. The situation remains very fluid, with the uncertainty likely to affect financial conditions and weigh on investment, but it is not yet clear how it will transpire. As such, we consider three potential scenarios:
- Exemptions expanded (potentially as broadly as to all countries apart for those highlighted in Commerce reports), retaliatory tariffs limited.
- NAFTA renegotiation unsuccessful, leading to implementation of tariffs on Canada and Mexico.
- Tariffs lead to consecutive rounds of retaliatory actions of increasing severity, ultimately manifesting in an all-out trade war.
Why the actions?
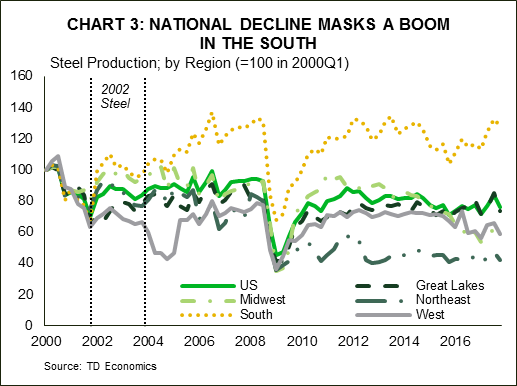
Chart 3: National Decline Masks a Boom In the South
 The actions undertaken by the Trump administration on steel and aluminum build on other efforts intended to level the global playing field for export-exposed industries in the hopes of supporting, and potentially reviving, the U.S. manufacturing sector. In addition to the economic reasons, steel and aluminum industries are considered strategic, with their continued decline raising national security concerns:
- U.S. steel production today only satisfies 76% of overall national consumption, and has fallen by 20% since the early-2000s when it accounted for around 90%. Employment has declined even more sharply, down 40% since then. These trends mask hide a significant shift in production and employment towards Southern states where production is up 28% since early-2000 (see Chart 3).
- As U.S. steel production capacity has been mothballed, any additional demand was satiated with imports, which tripled since early-2000s. To cope, U.S. supply chains have shifted primarily to Russia, Korea, and, until 2008, China. Given its proximity and benefits under NAFTA, Canada remains the largest single supplier of steel to the U.S. market, accounting for 15% of imports (see Table 1). Having said that, the U.S. has a trade surplus with Canada in steel, highlighting the tightness of the supply links and the mutually beneficial relationship.
While China ranks only sixth currently in terms of U.S. steel imports, it was the top exporter between 2006 and 2008, as its exports grew tenfold in five years In fact, nearly all of the increase in global production since 2000, has been in China as it expanded six-fold to account for 50% of global output – up from a 15% in 2000 and 8% in 1990. - The rise has been even more pronounced in the aluminum market, where China’s share of global production rose from just 5% in 2000 to 55% currently. U.S. producers have seen production and employment shares fall just as sharply, down by nearly half (Chart 4). Canada dominates the U.S. import market as a supplier accounting for 40% of U.S. imports, followed by China, Russia, and the U.A.E. at near 10% apiece.
Chart 4: Steel and Aluminum Production Jobs in Long Term Decline
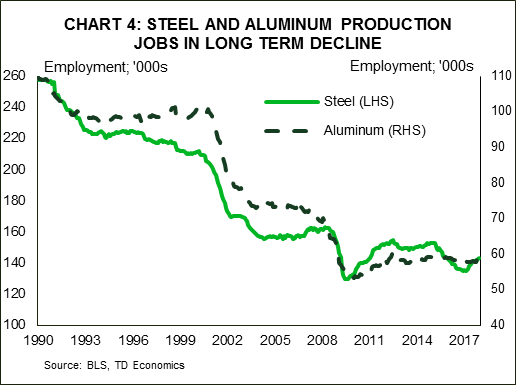 Chart 5: Chinese Production Surges After WTO Entry
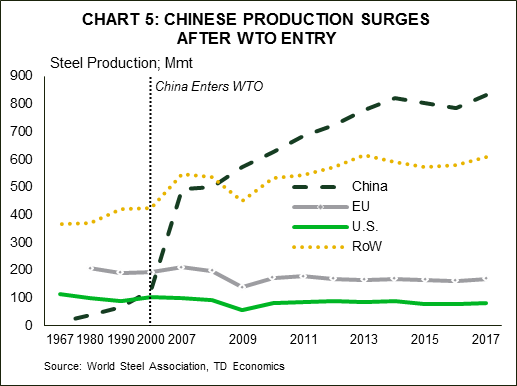 China’s push to become a key supplier to the world economy (Chart 5) has received much attention, due to its speed and substantial use of state subsidization. Moreover, the Chinese efforts to grow market share have been instrumental in keeping global steel prices down.
In Defense of National Security
U.S. trade cases have typically been brought about by businesses and industry organizations, with actions then implemented in cases where there is evidence of injury to domestic industries, particularly as a result of subsidies or unfair trade practices. In contrast, the steel and aluminum tariffs just signed were initiated by the government and used a relatively uncommonvi “national security” provision following an investigation under Section 232 of the Trade Expansion Act of 1962. The rationale for steel and aluminum tariffs is centered on the national need to maintain domestic production levels sufficient to satisfy the Department of Defense’s national defense requirements as well as the needs of critical infrastructure sectors, such as power grids, transportation, water, and energy generation systems. Achieving this would require a level of domestic steel and aluminum production consistent with an 80% of the 2017 utilization rate of factors of production.
Potential economic impacts
Chart 6: 2002 Tariffs Hit Non-NAFTA Imports, Raised Production
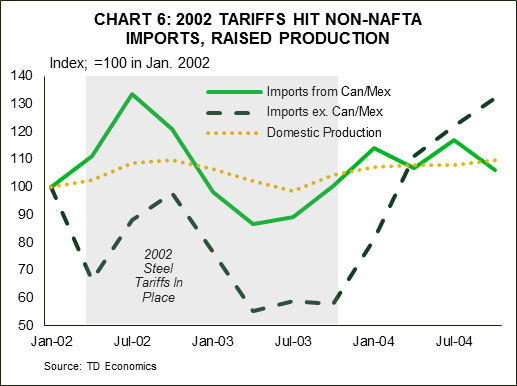 Assessing the potential economic impacts of the tariff plan is a complex exercise, but we look to history for to offer some insight. After launching an investigation under Section 202 of the Trade Act of 1974 seeking to determine whether challenges faced by the U.S. steel industry merited trade actions, the Bush administration raised import tariffs on steel, ranging from 8-30%vii, to help shore up the strategically important industry. Those tariffs were comparable to the current levels, though more targeted, and narrower in scope at just over half of all steel imports. Moreover, they exempted Canada and Mexico, as well as nearly eighty developing countries. Steel prices surged over 20% in the aftermath of the tariff hike, while utilization increased alongside a near 10% rise in domestic production. At the same time, imports fell more than 28% with the exception of those from NAFTA partners which increased 7% (Chart 6). The tariffs were established for three years but were cancelled in December 2003 – some fifteen months early.
Times have changed since then on many fronts. The structure of the steel market differs, with China accounting for a larger share of global production. Its non-market structure means that supplies may be less susceptible to changes in near-term market conditions. In addition, the U.S. shift towards tariffs is occurring at a time in the economic cycle when inflation risks are brewing. This may limit the extent and speed at which the steel and aluminum industries can ramp-up production beyond existing capacity amidst scarce labor and more aged equipment.
Scenario 1A: Status quo (exemptions and tariffs as signed, limited retaliatory measures)
The impacts from the imposition of tariffs will be most apparent in the United States, where it is a classic case of winners and losers: producers of steel and aluminum benefit while the steel-intensive manufacturers and, to a lesser extent, nonresidential builders and oil & gas drillers lose from higher input costs.
Price (inflationary): U.S. prices of steel and aluminum should rise by less than the full tariff amount given Canada and Mexico’s exemption. We assume (conservatively) that steel prices rise by around 20% and aluminum by 8%, pushing up producer prices, particularly across industries heavily-reliant on steel/aluminum as inputs. The higher costs would then flow through to the CPI, but any pass-through potentially limited by the improved profit margins from the recently-implemented business tax cuts. However, we still expect car prices to rise by about 1%, adding nearly $300 to the sticker price, with US CPI some by 0.2% higher over eight quarters, adding about 0.1 percentage points to the annual inflation rate.
Output (modest drag): domestic steel and aluminum production will ramp-up by over 10% within a year of implementation, with employment expected to increase by about 5,000 to 10,000 in these sectors nationally – U.S. Steel (500 jobs, IL) and Century Aluminum (300 jobs, KY) already announced production increases. But, these gains will be offset by losses of 25,000 to 50,000 in steel-intensive manufacturing made less competitive by higher domestic metal prices. Industries such as: fabricated metals, machinery, autos, aerospace, and other transport equipment will be hardest hit (see Table 2). Higher prices will reduce consumer’s buying power, diluting some of the positive impact on spending from the tax cuts embodied in the recent tax cut. Overall, growth is likely to be a touch lower in 2018, while net employment drops by a slight 20,000 to 40,000 relative to business-as-usual levels.
Monetary policy (tightening tilt) – the upward pressure on prices from these and other tariffs will only further complicate the Fed’s job of engineering a soft landing. While central banks tend to look through one-time shocks, it would provoke a response to the extent that those shocks combine with already existing economic pressures to increase future inflation expectations. The price impact of the tariffs raise the risk the Fed will need to raise rates four times this year and maybe more.
U.S. dollar (appreciation) – these tariffs should narrow the trade balance by $10 to $30 billion per year, as well as contribute to marginally higher inflation and tighter Fed policy, which are all unambiguously U.S. dollar positive. Currency movements are likely largely priced in, but further targeted U.S. protectionist actions could drive the U.S. dollar higher, while significant retaliatory tariffs would do the opposite.
Canadian impact (modestly growth positive) – Canada’s temporary exemption is a better outcome than was initially feared. It could help boost employment by about 1,500 across the steel and aluminum sectors to compensate for the additional demand that will need to be met as other countries pull-back exports on the tariffs. But, ultimately, the employment levels in the steel and aluminum industries are small relative to the entire labor market, at around 24,000 and 10,000, respectively, and the additional demand is unlikely to cause a ramp-up in investment across the Canadian primary metal sector - particularly in light of the temporary nature of the exemptions which adds uncertainty. Importantly, maintainting the exemption will also likely require the Canadian government monitor and prevent the flood of Canadian markets with international steel and aluminum intended to circumvent the U.S. tariffs, so as to not be viewed as complicit.
A cloud of uncertainty will indeed continue to overhang these and other tradeable sectors as NAFTA talks proceed slowly and risk getting delayed into 2019. The Canadian dollar, which has been losing ground recently, is likely to remain on the back foot. And, as the Bank of Canada indicated at its recent rate decision, trade uncertainty is a key reason why it will remain cautious in raising rates. It is also instrumental for why we believe there will be only one further rate hike this year.
Other impacts are expected to be modest under the current plan where Canadian producers are exempt. There will be some knock-on effect on prices from the U.S. tariffs directly, through higher North American steel and aluminum prices, as well as indirectly through the Canadian dollar. Overall impacts on Canadian CPI are estimated to be positive, but relatively marginal.
Scenario 1-B: Exemptions extended to all countries except those outlined by Commerce
Aside from the exclusions already provided to Canada and Mexico, this scenario would have additional countries apply, and be granted, exemptions to the tariffs, except for the fourteen outlined in the Commerce reports: 12 for steel and 5 for aluminum. Since any new exceptions will most likely be offset by higher tariffs on those not-exempted, total U.S. imports of steel and aluminum would remain unchanged. In the extreme case, in which all unlisted countries got exempted, tariffs would rise to 53% and 23.6% for the fourteen paying the tariffs.
By design such a scenario would only see the source of the imports into the U.S. change, while the volume of imports, the subsequent domestic production, and prices would be by and large unchanged with impacts as in the “status quo” or 1-A scenario. But, in the case of Canada, the modestly higher output and employment from displacing from other countries exports in scenario 1-A, would dissipate as more countries got exempted.
Scenario 2: tariffs are implemented on Canadian steel and aluminum
Under this scenario, the impacts on Canada would clearly be more significant than under either of the scenario 1 exemptions. But, on the face of it, those impacts appear quite modest in the context of the broader job market. Hiring in the primary metal sector would drop by as much as 5,000, with the concentration within Ontario and Quebec. Inflation would be higher on steel and aluminum costs, as well as an even lower loonie.
But, here is where an assessment gets more complex. The imposition of tariffs would overlay already contentious NAFTA negotiations. This would likely increase Canadian economic uncertainty and market volatility. If the administration looks poised to withdraw from NAFTA with 6 months of notice, the Canadian dollar would fall under significant pressure – by as much as 5-10%. This would help shield exporters from the effects of the higher tariffs, but also boost inflation temporarily. The Bank of Canada should see through the move with relatively little implication for monetary policy, with rates already depressed on NAFTA break-up.
Scenario 3: All-out global trade war
We view such a scenario as highly unlikley and consider it the worst of the worse outcomes, making any prediction of economic impact even more complex. Such a war would presumably start as countries engaged in subsequent rounds of tariff placement across varying products. The ensuing uncertainty would hamper investment and exports, weighing on global growth. The scenario would also have severe financial market implications, with increased volatility and flight to safety. In fact, this scenario could be a recession-trigger should credit-spreads widen and corporate costs rise both through this channel and that of production inputs. In addition, market deterioration would erode business and household confidence. This would lead to higher values of US dollar, yen, and franc, and increased demand for the safest government bond yields, pressuring yields lower. In a “best case” scenario, a trade war that occurs gradually and over a long period could instead result in a stagflation scenario – inflation accelerating on higher prices, and growth stalling from output reduction.
Bottom line
Despite the overarching anxiety about the recent steel and aluminum tariffs, there was a sigh of relief within financial and political spheres, particularly in Ottawa and Mexico City. The details of the document and rhetoric coming out of the White House were generally constructive in so far as leaving open the possibility for further exemptions. This has left many hopeful they can dodge the bullet, while at the same time readying their own lists of potential tariffs they could retaliate with should an exemption not be granted. We believe most countries that seek an exemption, with the exception of those outlined as bad-apples by the Commerce Department, should be able to win it. On the other hand, those with little hope of securing an exemption will likely pursue retaliatory tariffs. While we cannot rule out a risk that the these tariffs could set in motion a chain of events whereby countries impose successive rounds of tariffs on each other, we don’t view a trade war as the most probable scenario. Ultimately we hope cooler heads will prevail.
China Releases Important Data as Trade Frictions Continue to Attract Attention; Aussie in Focus
China will see the release of numbers on February’s fixed asset investment, industrial production and retail sales on Wednesday at 0200 GMT. Barring retail sales, the figures are expected to have eased on an annual basis relative to January’s respective releases. As the readings are made public, attention will be falling on the aussie as well as on any implications for the global economy.
Annually, fixed asset investment, industrial output and retail sales are projected to have grown by 7.0%, 6.1% and 9.8% respectively during February. These compare to January’s corresponding figures of 7.2%, 6.2% and 9.4%. Thus, a minor slowdown is projected in fixed asset investment and industrial production, while retail sales are anticipated to have expanded at a quicker pace relative to the month that preceded. Retail sales, which are a proxy for consumption, are seen continuing to grow faster than either fixed investment or industrial output.
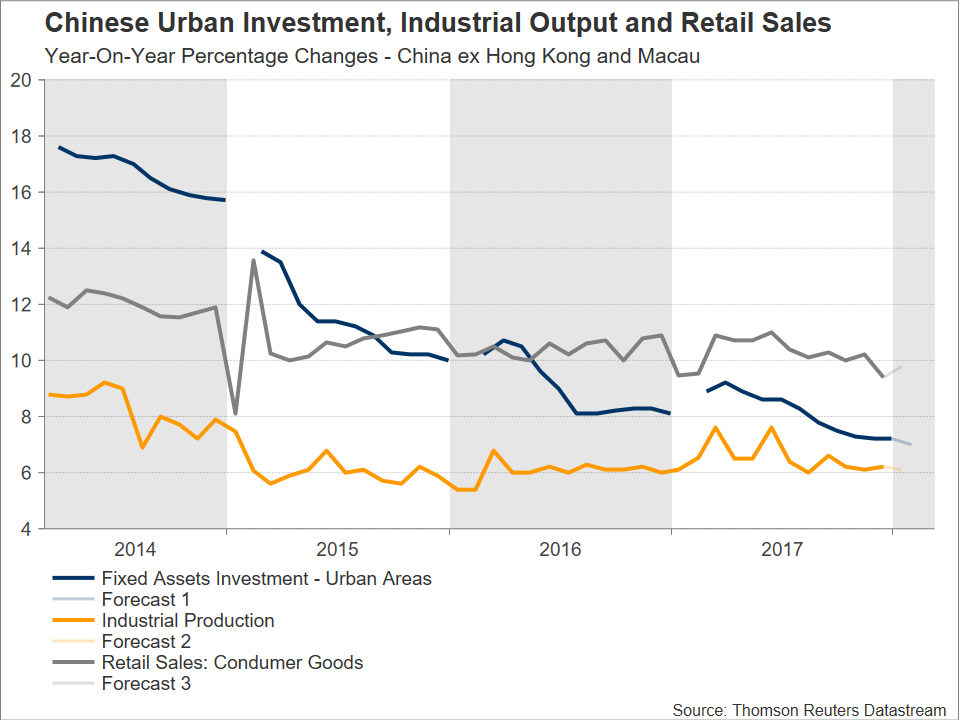 Despite some easing expected in some of the readings, for the most part – should projections materialize – the numbers are pointing to resiliency, especially if viewed in light of ongoing government efforts to curb environmental pollution as well as reduce risks in the financial system by reining in credit growth; both of these are factors weighing on activity, at least in the short-term. Latest news on the clampdown of financial risks indicated that Beijing intends to merge its banking and insurance regulators with the objective to better identify and control risks in the financial sector.
It should also be kept in mind that Lunar New Year celebrations fell in mid-February this year, distorting data releases during the month and rendering judgements on overall trends not that useful. Combined January and February data for fixed asset investment, industrial output and retail sales will also be made public tomorrow, in an attempt to factor out the volatility linked to the period of festivities.
In currency markets, yet again, the aussie which is viewed as a liquid proxy for China’s economy due to the close economic ties between China and Australia – the former is the latter’s largest export and import partner – will be gathering attention as the figures go public.
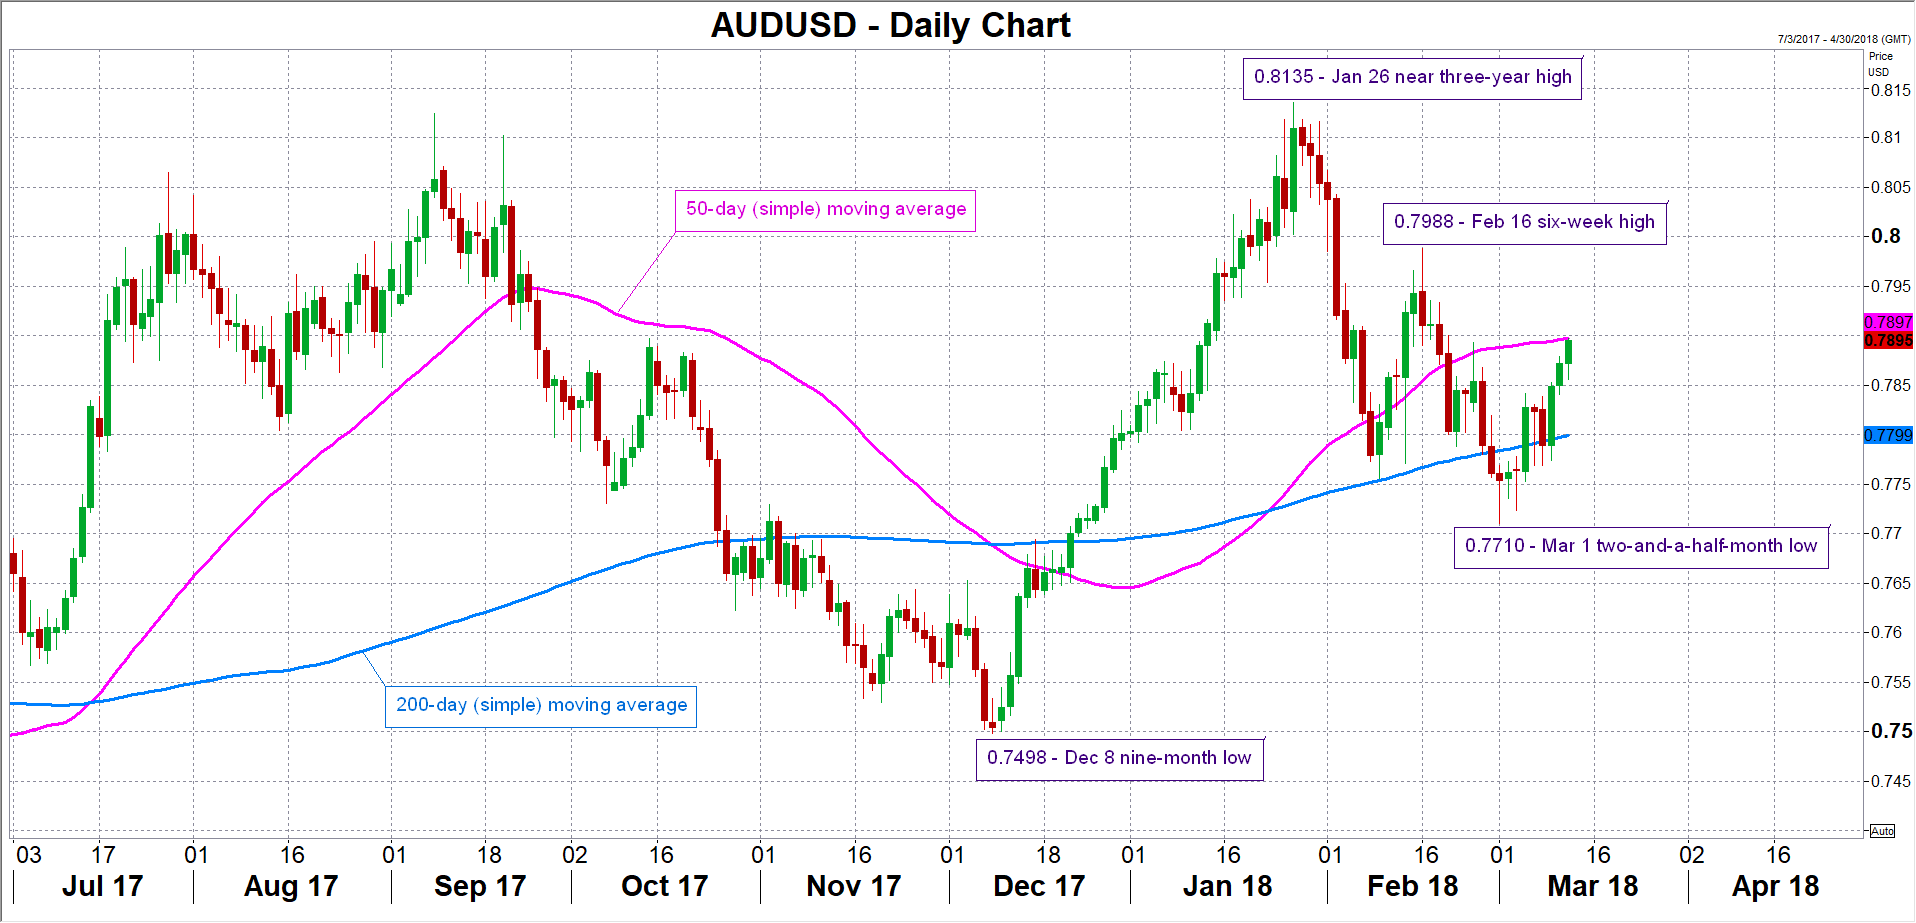
A data beat might spur long aussie/dollar positions. The pair is potentially meeting a barrier around the current level of the 50-day moving average at 0.7897 at the moment. The area around this level was congested in the past and also encapsulates the 0.79 handle that may be of psychological importance. A break above this area would turn the attention to the range around the six-week high of 0.7988 – including the 0.80 level – that was recorded on February 16.
On the other hand, should the numbers disappoint, aussie/dollar might post losses, with support possibly coming around the 200-day MA at 0.7799. Notice that this includes the 0.78 level that could also hold psychological significance. In case of more bearish movement, the attention would start to increasingly shift towards the two-and-a-half-month low of 0.7710 from March 1. Note that the pair is currently trading around three-week high levels after touching 0.7897 at its peak earlier on Tuesday. The pair was boosted on Tuesday after National Australia Bank’s index of business conditions climbed to its highest on record in February, pointing to broad-based industry strength, but also gained on the greenback’s weakness after Rex Tillerson was sacked from the position of Secretary of State.
 Strong data might also spur positive sentiment in regional, and potentially international, equity markets and vice versa.
On dollar/yuan, it is worth noting that the pair is down by 3.0% year-to-date. On Tuesday, it was supported after the PBOC set a firmer midpoint rate for the pair.
Also China-related, the annual National People’s Congress meetings are currently taking place in Beijing and are set to continue through March 20 with the scope of setting the tone for the year ahead in terms of goals to be met. Last week, Premier Li Keqiang kicked off these parliamentary meetings by announcing that the nation’s growth target for 2018 will be around 6.5%, the same as last year when the economy actually grew by 6.9%.
Lastly, rising trade tensions after the recent decision by the Trump administration to impose tariffs on steel and aluminum, but also the US urging China to reduce its bilateral trade surplus with the country, deserve mention. Any retaliatory actions by China undeniably have the capacity to spur movements in the markets. An outright trade war is more probable following the latest developments, though, at least for the time being, it looks far from the base case scenario. Since reference was made to the aussie, it should be said that an escalation of trade frictions is likely act to its detriment as Australia heavily relies on commodity exports and the currency tends to outperform when global risk appetite is strong.
US Retail Sales Next in Line to Shake the Dollar
The US will see the release of its retail sales data for February on Wednesday at 1230 GMT. While consumer spending softened in January, it’s projected to have bounced back in February. If confirmed by the actual data, this would be an encouraging development for Fed policymakers, who are widely anticipated to raise interest rates at their upcoming meeting next week.
US retail sales are forecast to have risen by 0.3% on a monthly basis in February, a rebound following a 0.3% decline in the previous month. The core figure – which excludes automobile sales – is also expected to have climbed by 0.3%, after stagnating in January.
Consumer sentiment indicators were particularly upbeat during the month, supporting the forecasts for a rebound. The Conference Board consumer confidence index surged to reach a high last seen in 2000, while the University of Michigan print that the Fed pays close attention to rose as well, almost reaching multi-year highs. More broadly, while the gains in US wages were somewhat subdued in February, the labor market continued to add jobs at a robust pace and the unemployment rate remained very low, painting a bright picture for consumer spending. Enhancing this argument, are the recently-enacted US tax cuts, which may result in a modest increase in the disposable incomes of consumers.
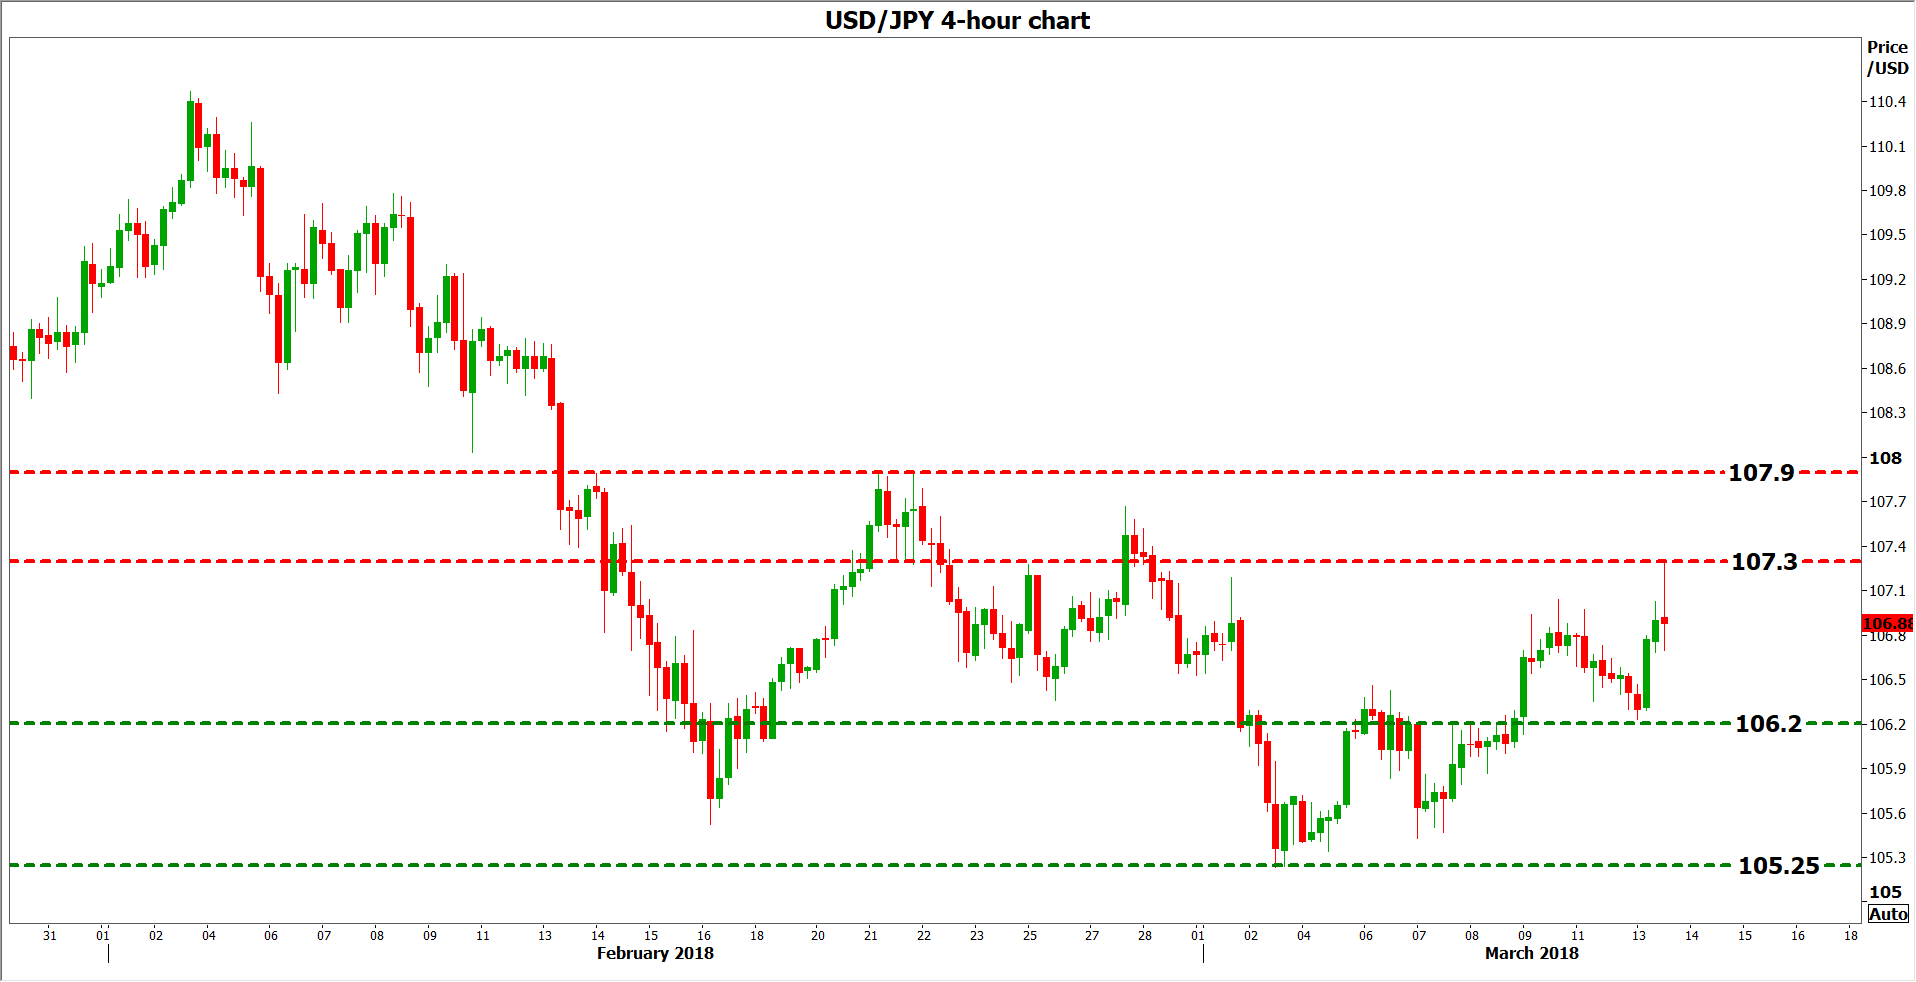
At the time of writing, markets have fully priced in two quarter-point rate hikes by the Fed this year according to the Fed funds futures, and also see a 90% probability for a third one. In case the retail sales data come in stronger than anticipated, that could seal the deal for three hikes this year and may even raise speculation for a fourth, thereby helping the dollar to regain some of its latest losses. Dollar/yen is likely to edge up in this scenario and challenge the 107.30 resistance zone again, marked by the peaks of February 25 and March 13. A potential upside break of that area would shift the focus to the 107.90 hurdle, identified by the highs of February 21.
On the flip side, in case of a disappointment in these data, markets may become even more skeptical regarding whether the Fed will indeed deliver a third hike, something that would likely weigh on the greenback. Dollar/yen could fall back below the 106.20 hurdle, marked by the lows of March 13, and perhaps aim for a test of its recent troughs at 105.25.
Sunset Market Commentary
Markets:
Global core bonds eked out small gains today. The German Bund found support from an intraday deterioration of risk sentiment on stock markets. Technically, the contract tests the 157.43 resistance area which coincides with a test of 0.62% support of the German 10-yr yield. The US Note future temporary outperformed the Bund after media reported that US President Trump sacked US Secretary of State Tillerson. The news arrived about simultaneously with US CPI data which printed in line with expectations. Headline inflation accelerated further above the Fed’s 2% inflation goal (2.2% Y/Y). The safe haven spike on the latest political surprise by President Trump was short-lived with the US Note future returning to this morning’s levels ahead of tonight’s 30-yr Bond auction. The German yield curve steepens at the time of writing with yield changes ranging between -1.2 bps (2-yr) and +0.4 bps (30-yr). Changes on the US yield curve are even smaller. 10-yr yield spread changes vs Germany are nearly unchanged. Italian BTP auctions went relatively well despite the political deadlock. Greek bonds didn’t profit from the (anticipated?) upbeat message from the Eurogroup. SLOVGB’s hold firm despite the developing political crisis.
EUR/USD hovered in a tight range in the lower halve of the 1.23 big figure this morning with investors counting down to the key US inflation report. US February inflation printed exactly in line with expectations (0.2% M/M and 2.2% Y/Y for the headline, 1.8% Y/Y for core CPI). In line with the reaction on the US payrolls report on Friday, the market saw the (CPI) glass half empty. US yields and the dollar declined. The market concluded that inflation remains modest given the context of positive growth. At least for now, markets see no reason to consider faster Fed rates hikes than what is currently discounted. US president firing Foreign Secretary Tillerson was a temporary negative for the dollar, too. EUR/USD trades currently in the 1.2375 area. USD/JPY traded with an upward bias ahead of the CPI release. Political tensions due to a scandal within the Japanese government was/is a mixed factor for the yen. This morning it was considered yen positive. However later in the session, yen longs (USD/JPY shorts) were wrong-footed by a USD/JPY short squeeze. USD/JPY rebounded well above the 107 mark. The pair returned part of the earlier gains after the US CPI release (106.85 area). Despite today’s USD reaction, we don’t see the inflation report changing the Fed’s intentions on policy normalization.
The focus for sterling trading was on the half year UK budget statement of UK finance minister Hammond. The OBR revised 2018 growth slightly higher to 1.5% from 1.4%. Expectations for 2019/2020 growth were left unchanged at 1.3%. Minister Hammond indicated that he hoped the UK economy could beat the OBR forecast. Sterling gained a few ticks after the publication of the budget statement. However, we don’t expect the budget exercise to have a lasting impact on sterling. EUR/GBP trades in the 0.8860 area. Cable (1.3965 area) is again nearing the 1.40 barrier. However, this is due to dollar weakness rather than anything else.
News Headlines:
The EU could get an exemption from US steel and aluminum tariffs if the union was to be considered a reliable partner in fighting over-capacities, among other criteria, Politico reports, citing three unidentified people briefed on the outcome of US Trade Representative Lighthizer’s talks with European Trade Commissioner Malmstrom.
President Trump said that Rex Tillerson is out as secretary of state, after months of speculation over his fate, and that CIA Director Pompeo would be nominated to lead the State Department.
US February CPI printed in line with expectations both for the headline (0.2% M/M, 2.2% Y/Y) and core reading (0.2% M/M, 1.8% Y/Y/. US consumer price growth slowed from January on a monthly basis amid a decline in gasoline prices and a moderation in the cost of rental accommodation. NFIB small business optimism improved more than forecast, from 106.9 to 107.6.
Crude Sellers Trying to Get More Active
Crude oil prices were successful in getting stabilized Tuesday; most likely, the bears just took a break before new reasons for more activity come up. Brent crude traded around $64.95 Tuesday, with the 3-day low at $63.43 being tested before.
Shale oil companies were reported to be ready for increasing their daily output by raising the performance at each of the working oilrigs. According to EIA, the daily output per rig is going to rise from 635 barrels in March to 673 in April. Overall, shale oil production is expected to rise from 6.823M barrels to 6.954M. The US are relying upon increasing output in Permian Basin, and there are good reasons for that.
According to Baker Hughes report that came out Friday, the rig count in the US increased by 3; still, this report's details proved to be something to think over: oil rig count decreased by 4, while natural gas rig count added 7 units, which made the overall count positive. Some other details are very important as well, with the number of oil wells in development increasing by 110 and summing up at 7,601. Overall, these data are clearly positive, same as for Baker Hughes report showing growth YoY.
Oil inventories are being released in the US today and tomorrow. A 2-million-barrel growth is expected for crude, with gasoline and distillate inventories probably shrinking.
The market reaction is going to totally depend on the real figures; if those are higher than expected, investors will gain an additional reason for selloff.
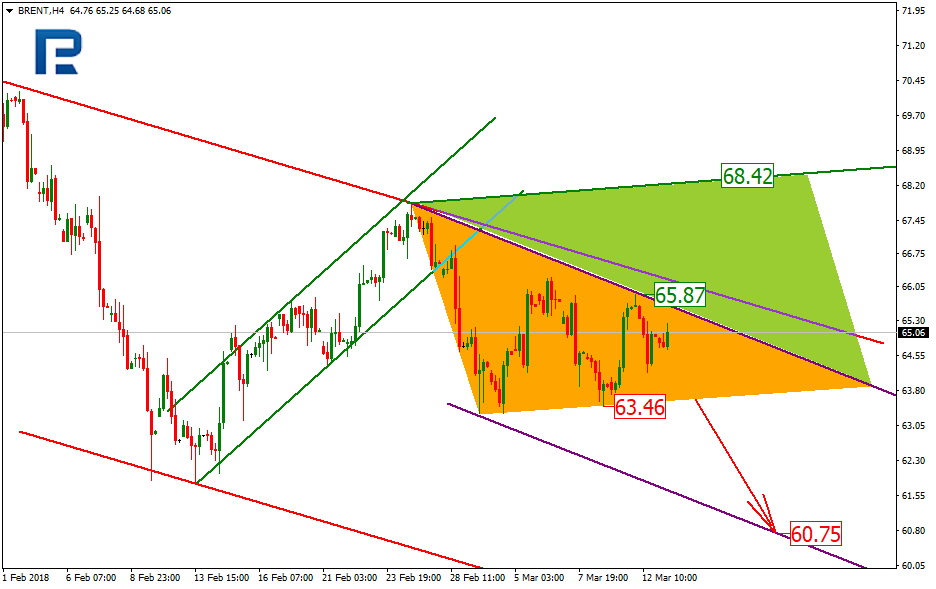
Brent mid term trend is a descending one, while in the short term, a triangle pattern has been forming. With the overall trend in mind, one could assume the black gold to break out the support at $63.46 and going down to the descending micro channel supper at $60.75. An uptrend is also possible, with the current resistance being at $65.87, which is fractal; so as long as this fractal gets broken through, the major channel resistance may be both tested and surpassed, which will lead the price to the projection triangle at $68.42.
BoC Poloz: Canadian labour force could expand by another half million
BoC Governor Stephen Poloz:-
- There are utapped potential in the economy, including workforce by youth, women, indigenous peoples, Canadians with disabilities and recent immigrants to Canada
- It is not much of a stretch to imagine that Canada's labour force could expand by another half a million workers,"
- If the economy builds more supply than usual, that will put downside risk on inflation; if less, that will create upside risk to inflation, and it is our job to balance those risks,"
- "We cannot know in advance how far the capacity-building process can go, but we have an obligation to allow it to occur."
Full speech Today's Labour Market and the Future of Work