Sample Category Title
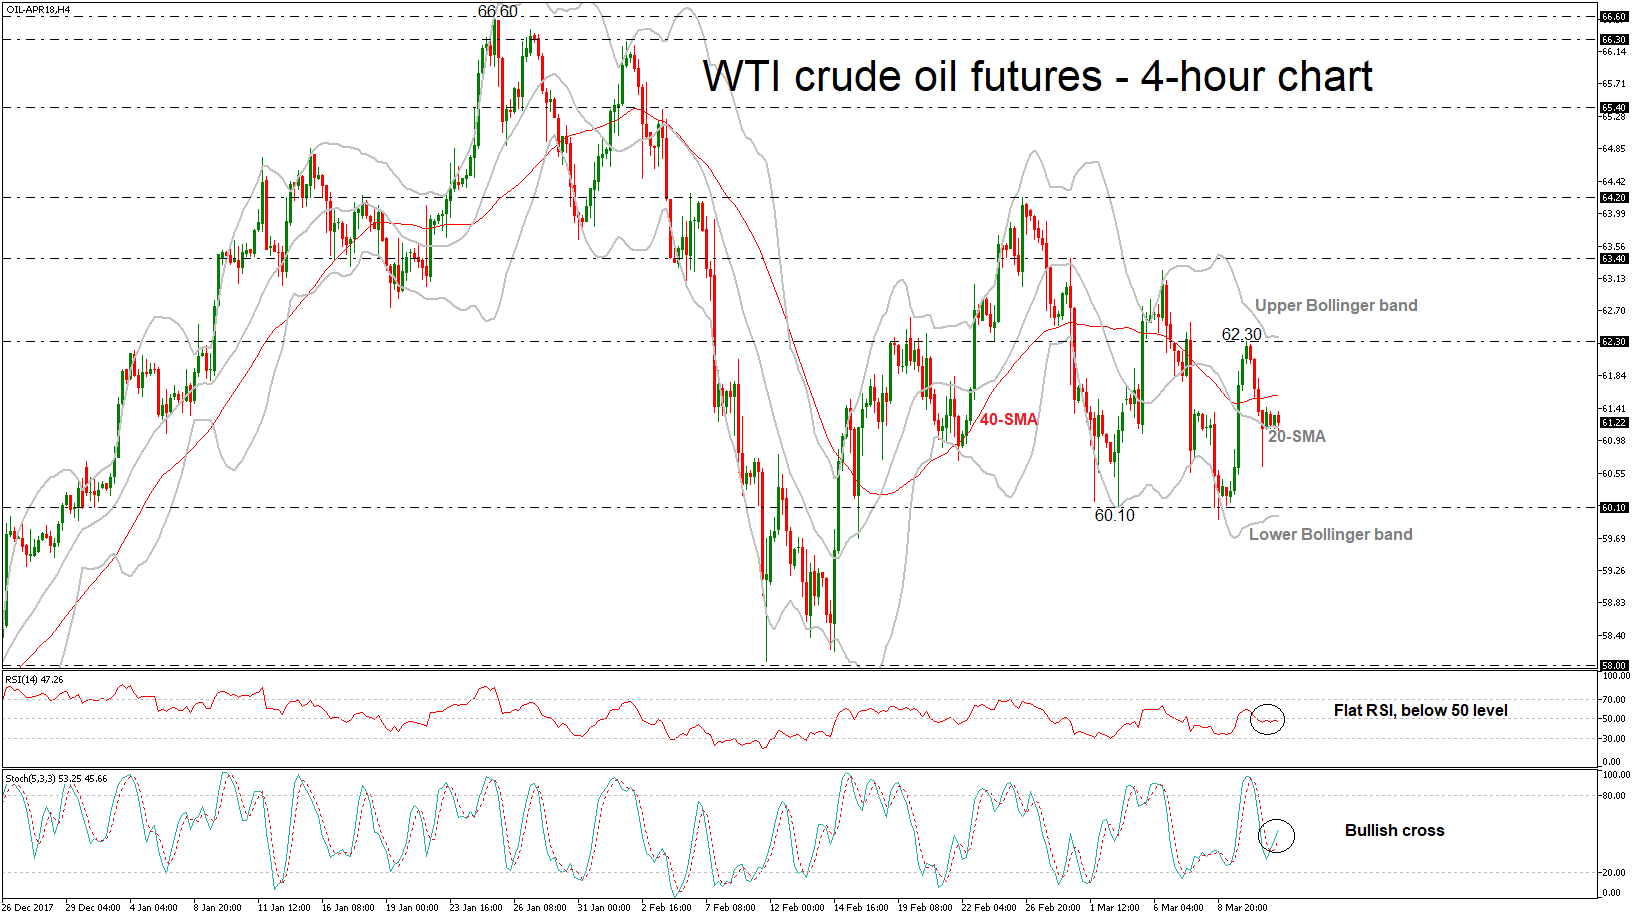
WTI Crude Oil Futures Post Neutral Sessions, Bollinger Bands Act Like Obstacles
WTI crude oil futures have been moving sideways over the last few sessions in the 4-hour chart, signaling weak momentum. The price hit several times the 20-simple moving average but failed to trade lower. Having a look at the bigger picture, oil has lost its aggressive buying interest but remains in bullish territory.
In the 4-hour chart, the RSI indicator is flattening slightly below the 50 level, while the stochastic oscillator posted a bullish crossover within its moving averages above the 20 level.
It is worth mentioning that WTI is developing within the Bollinger band in a sideways channel. To the upside, in case of a jump above the 40-SMA, the price could touch the 62.30 resistance barrier, which is near the upper Bollinger band. A further advance could open the door for the 63.40 level.
In the event of a bearish movement, then the focus could shift to the downside towards 60.10 and near the lower Bollinger band. If this level is breached, it could increase downside pressure and bring about a reversal of the trend until the 58.00 psychological level.
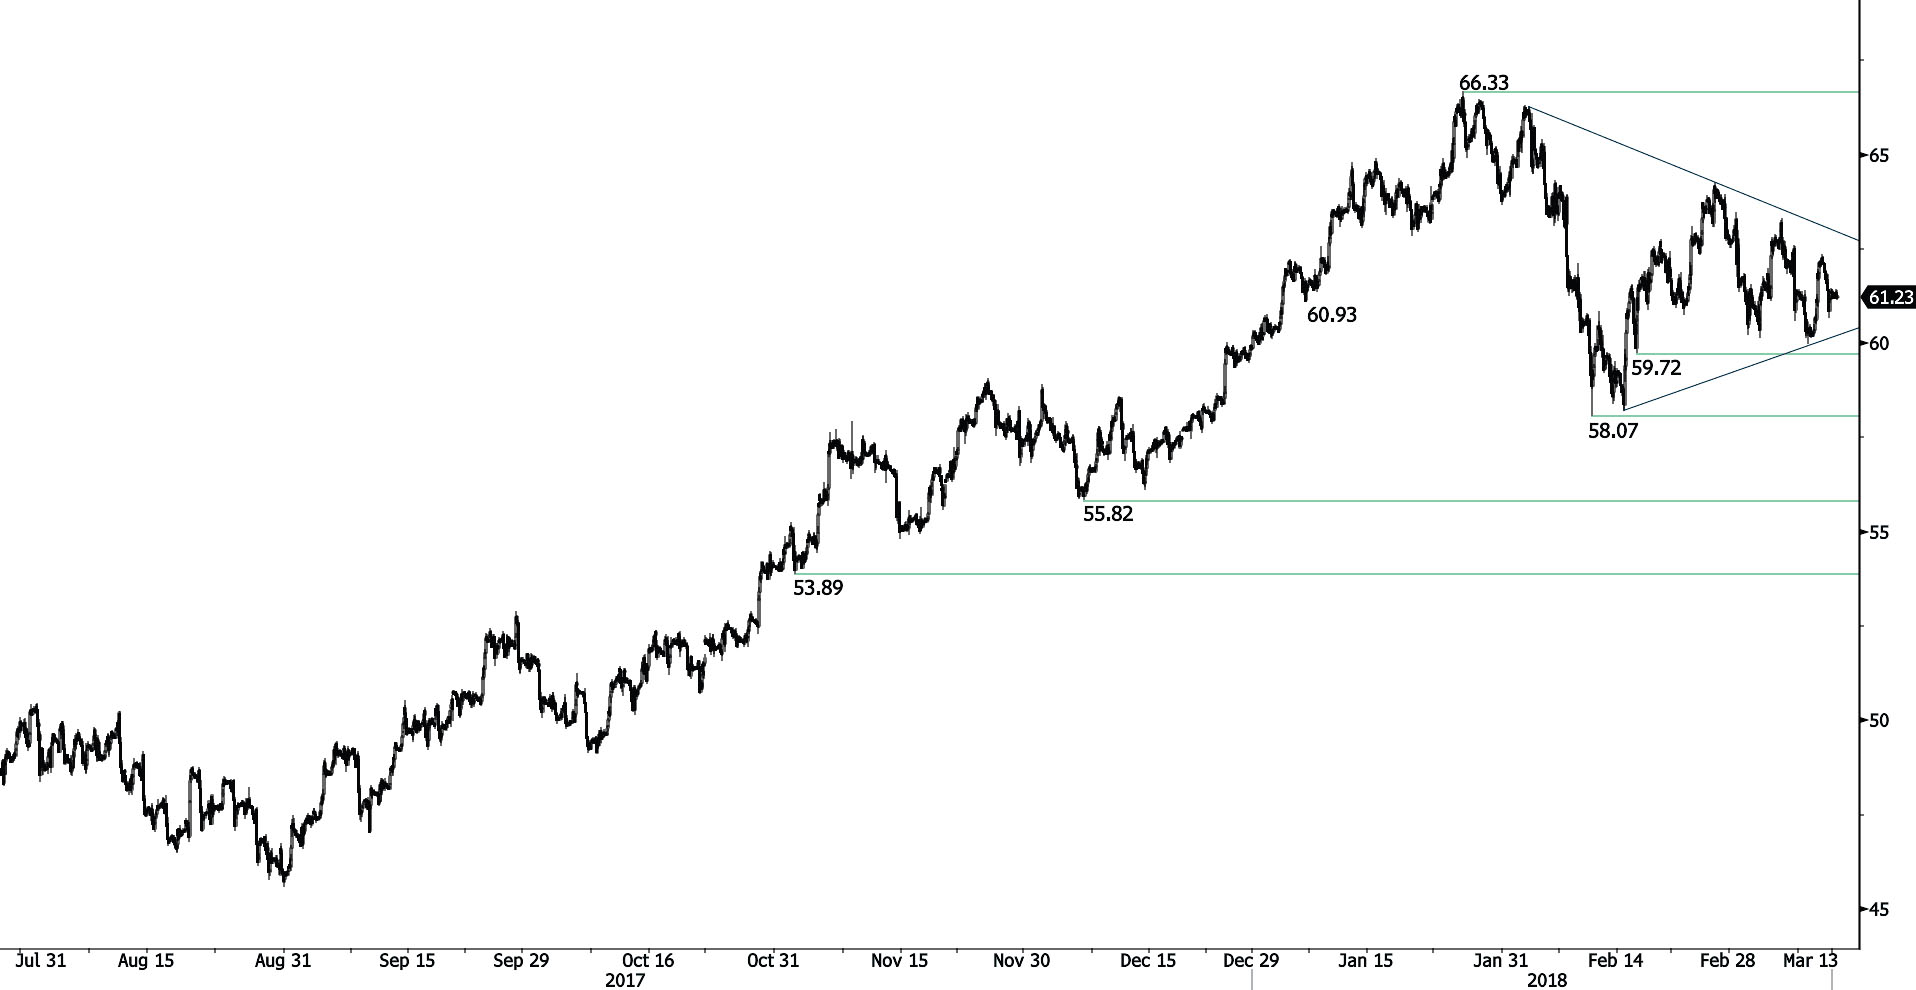
CRUDE OIL Consolidating
Crude oil continue sideways consolidation. Hourly support and resistance remain at 59.72 (15/02/2018 low) and 64.77 (11/01/2018 high). The technical structure suggests short-term decrease.
In the long-term, crude oil has recovered after its sharp decline last year. However, we consider that further weakness is very likely. For the time being, the pair lies in an upside trend since June 2017. Support lies at 42.20 (16/11/2016) while resistance is located at 77.83 (20/11/2014). Crude oil is trading largely above its 200 DMA.
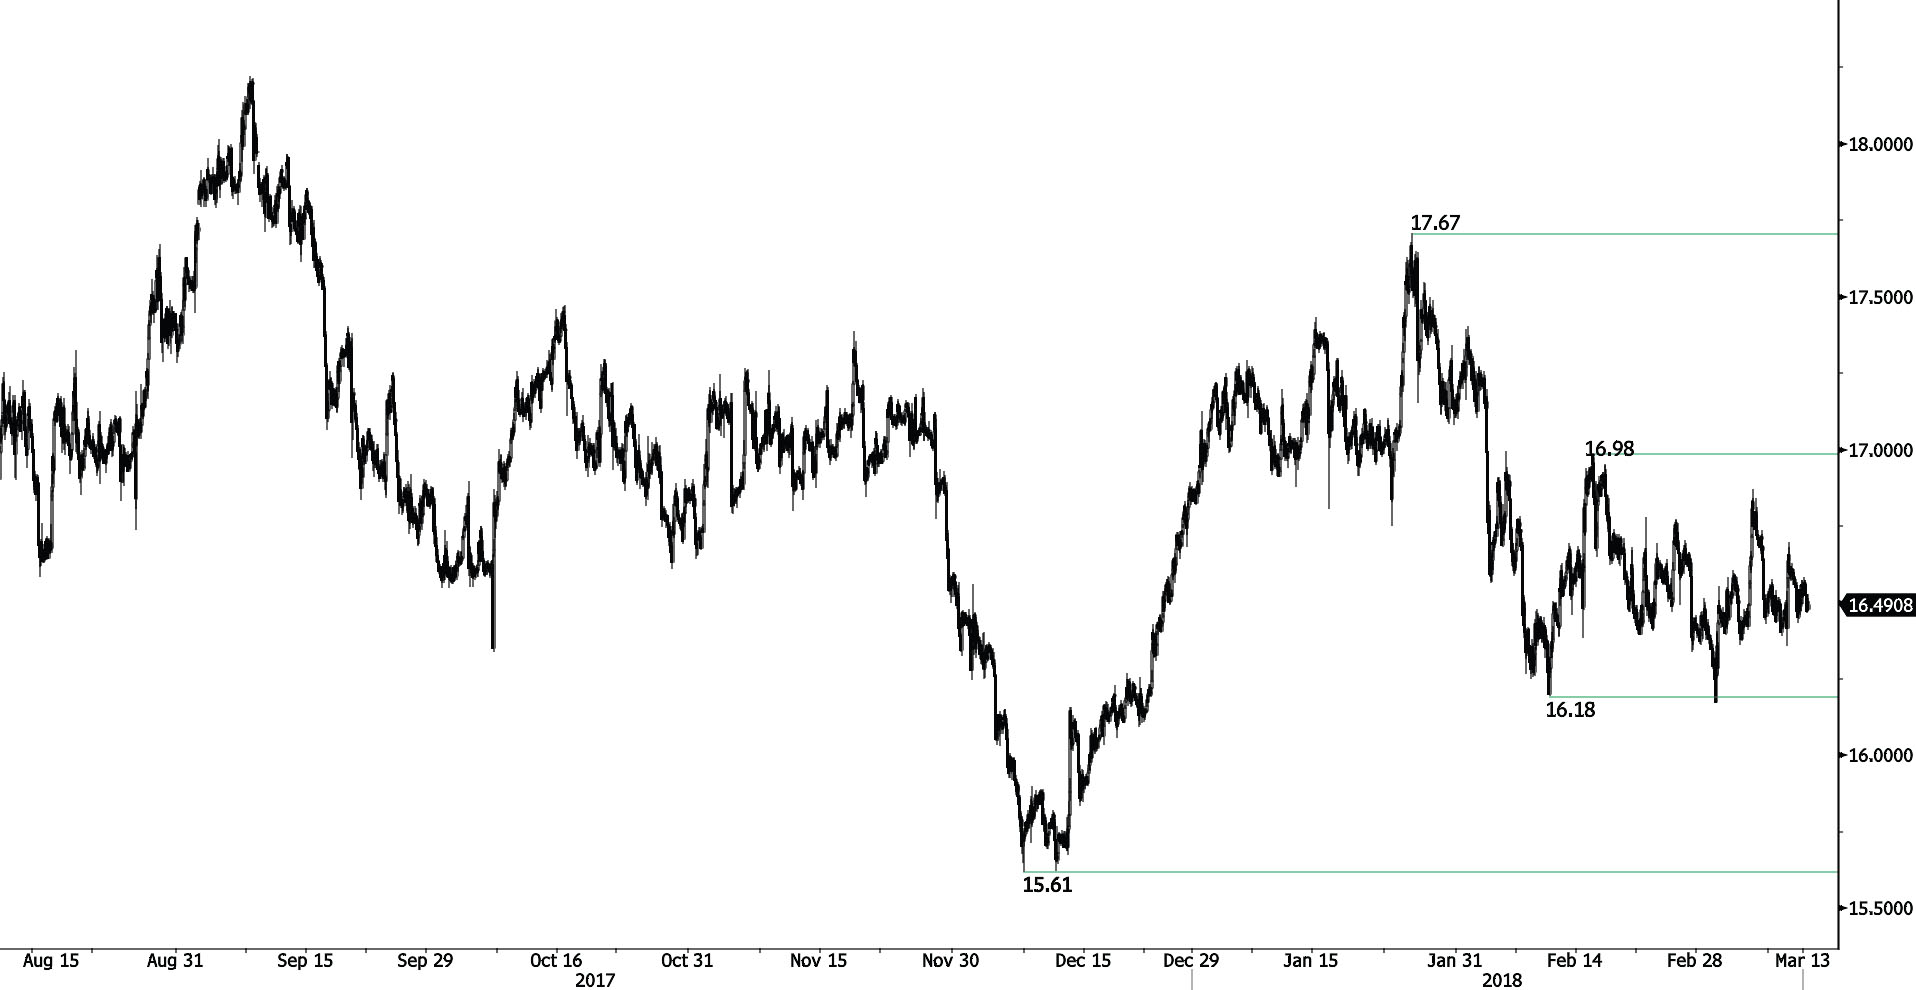
SILVER Sideways
Silver selling pressures have started, the pair is heading along the 16.45 range. The pair is contained between hourly support and resistance given at 16.25 (12/01/2018 low) and 16.98 (15/02/2018 high). The short-term technical structure suggests further short-term decrease.
In the long-term, the trend remains negative/ sideways. Further downside is very likely. The pair is trading below its 200 DMA. Resistance is located at 21.58 (10/07/2014 high). Strong support can be found at 11.75 (20/04/2009).
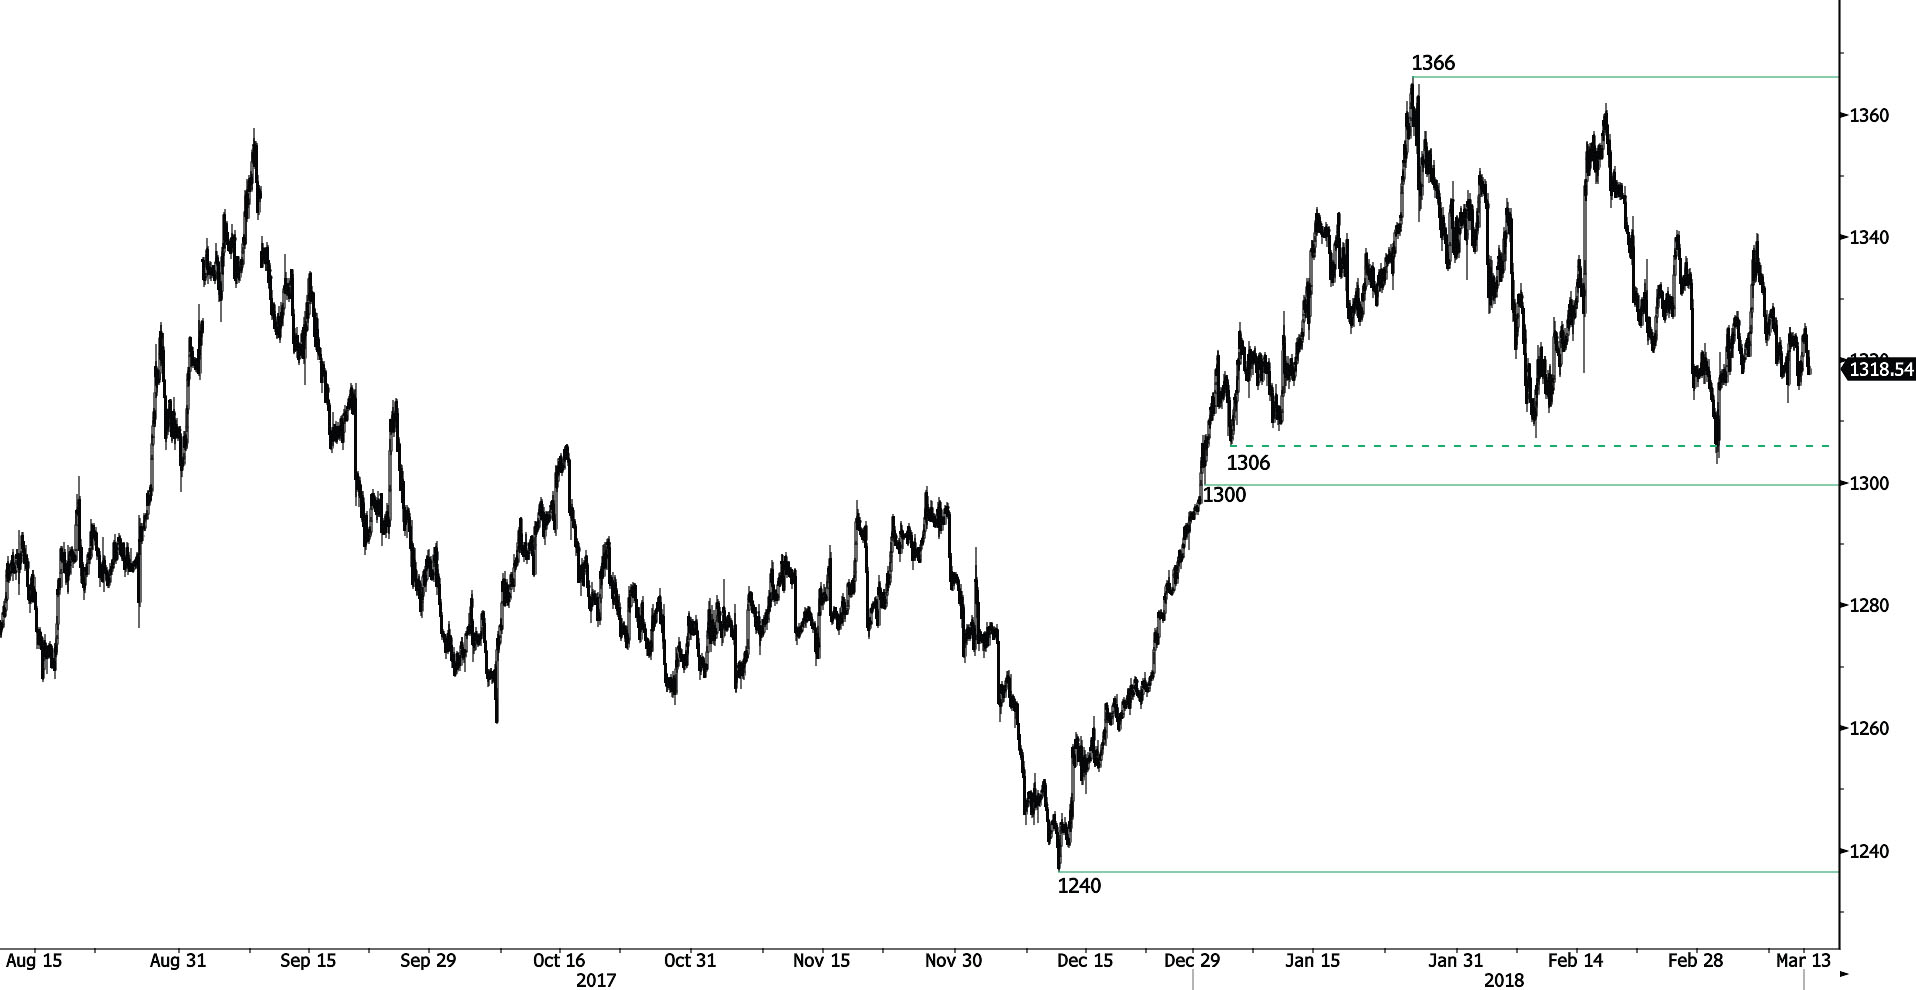
GOLD Moving Sideways
Gold is currently direction less. The pair is ready for another leg lower, approaching the 1325 range. The pair is contained between hourly support and resistance at 1300 (29/12/2017 low) and 1348 (20/02/2018 high). Expected to show further increase.
In the long-term, the technical structure suggests that there is a growing upside momentum. A break of 1'392 (17/03/2014) is required to confirm it. A major support can be found at 1'045 (05/02/2010 low).
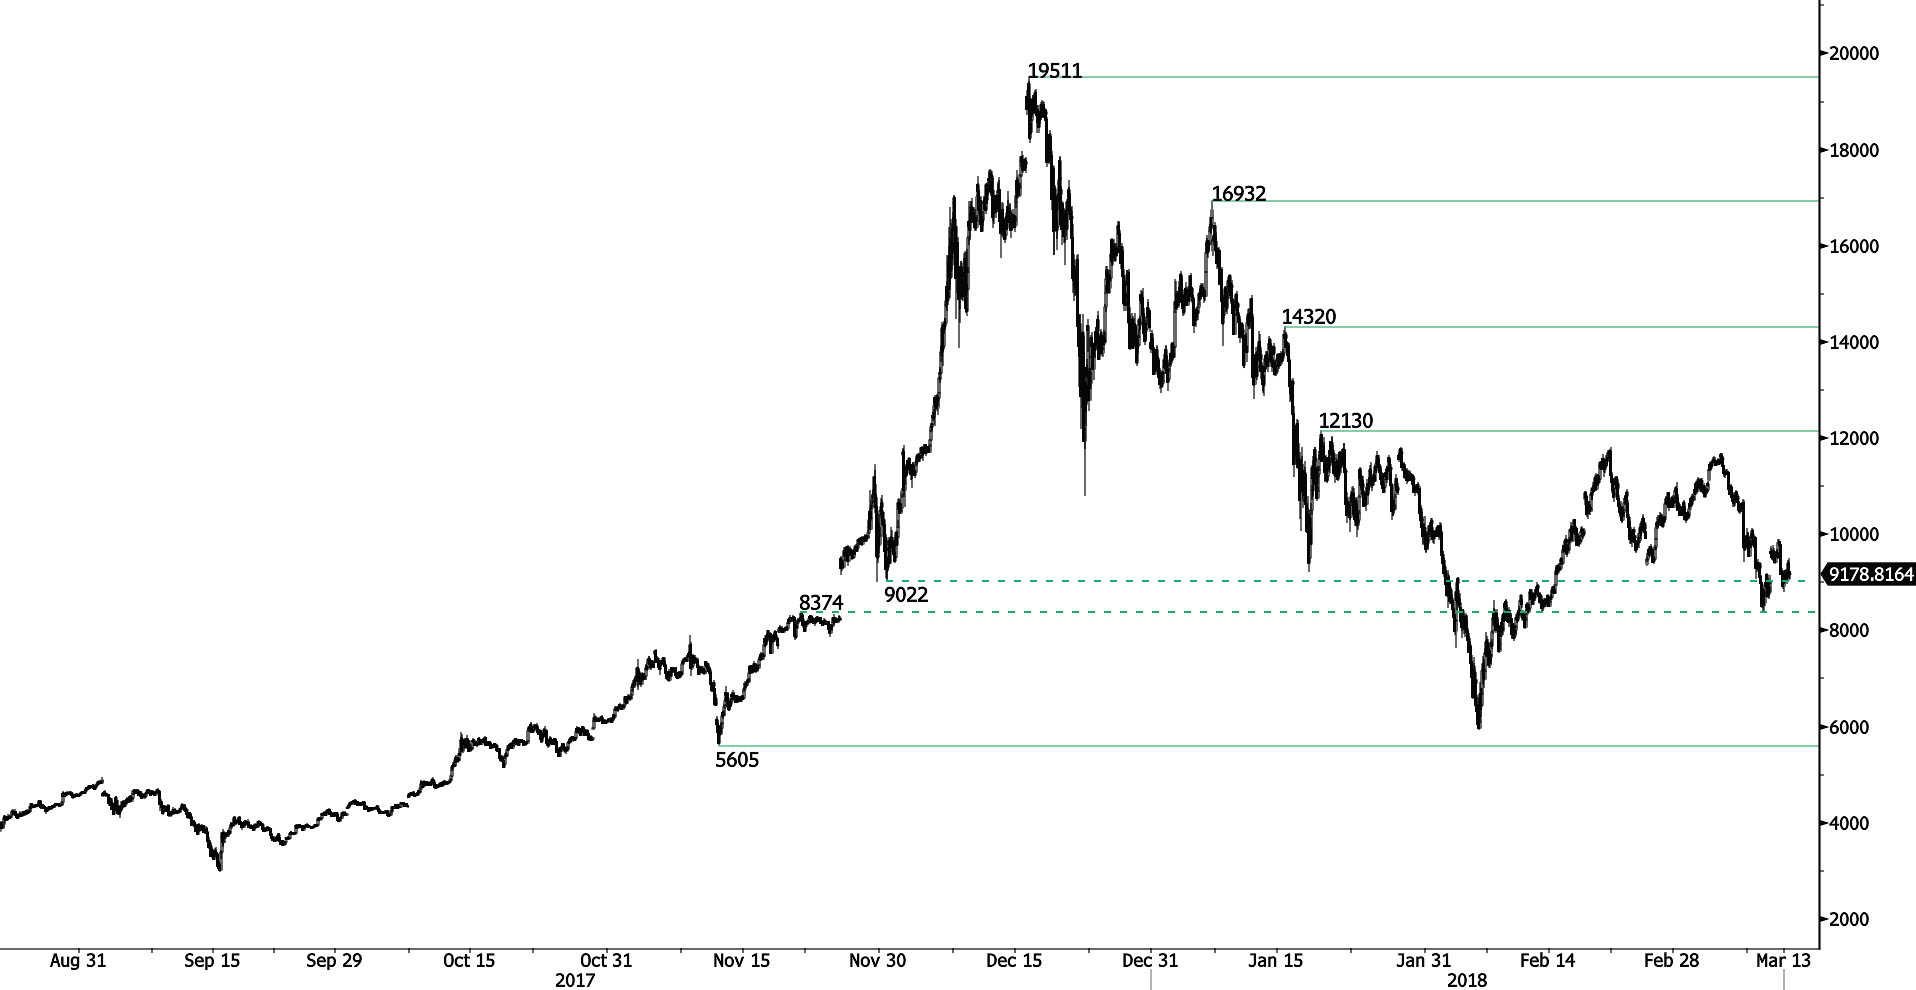
BITCOIN Slight Recovery
Bitcoin bounces back following its decline at 8368 and approaches the 10000 range. Expected to show short-term strength. Bitcoin is contained between hourly support and resistance at 7614 (02/02/2018 low) and 12130 (18/01/2018).
In the long-term, the digital currency has had an exponential growth but also presented important downturns. There is decent likelihood that the currency could stabilize between 7'000 - 12'000 in 2018. Bitcoin is approaching its 200 DMA (7000 range).
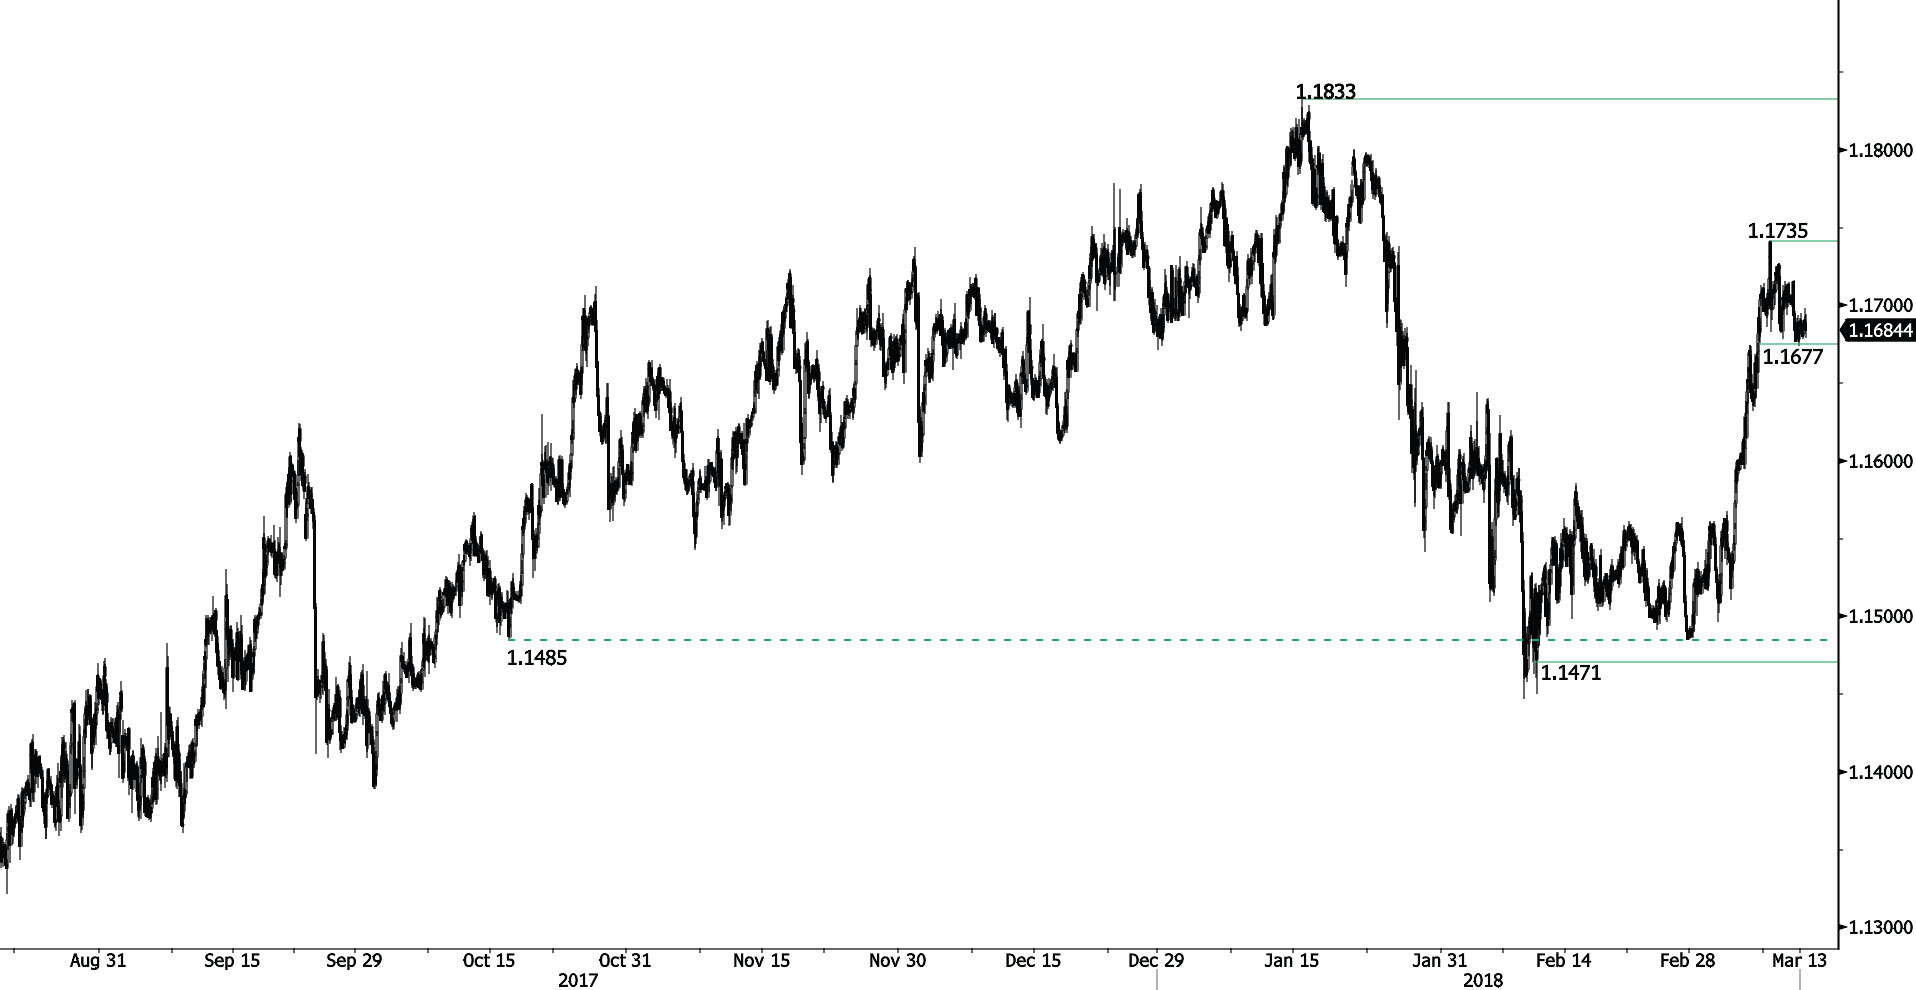
EUR/CHF Weak Bounce
EUR/CHF has now entered in a bearish momentum bouncing off 1.1677 support. Hourly support remains at 1.1659 (06/12/2017 low). The technical structure suggests further short-term increase.
In the longer term, the technical structure has reversed. Strong resistance is given at 1.20 (level before the unpeg). Yet, the ECB's slowing QE program is likely to cause buying pressures on the euro, which should weigh in favour of the EUR/CHF. Support can be found at 1.0234 (20/04/2015 low).
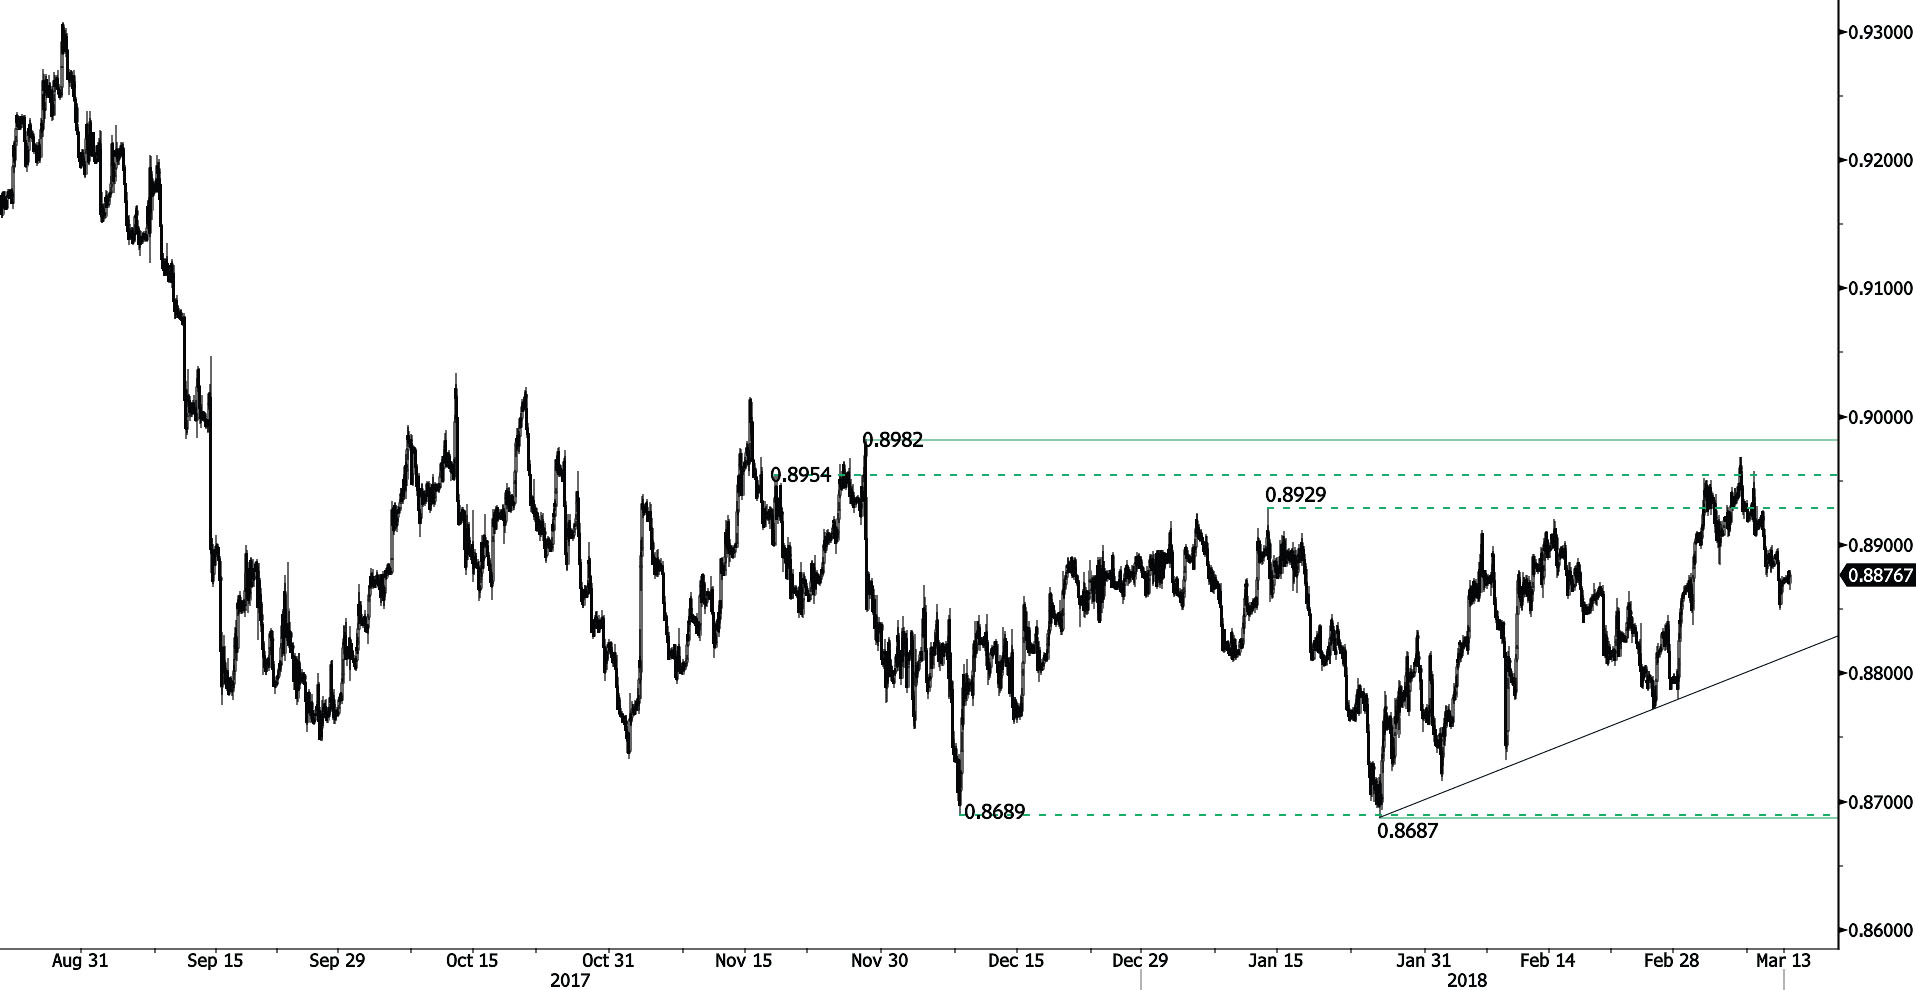
EUR/GBP Bearish Consolidation
EUR/GBP bearish momentum continues. Hourly support and resistance are given at 0.8883 (13/11/2017 low) and 0.8982 (28/11/2017 high). The technical structure suggests shortterm sideway moves.
In the long-term, the pair has largely recovered from 2015 lows. The technical structure suggests further upside pressure. Strong resistance can be found at 0.9500 (psychological level) while support remains at 0.8304 (05/12/2016 low). The pair is trading above its 200 DMA.
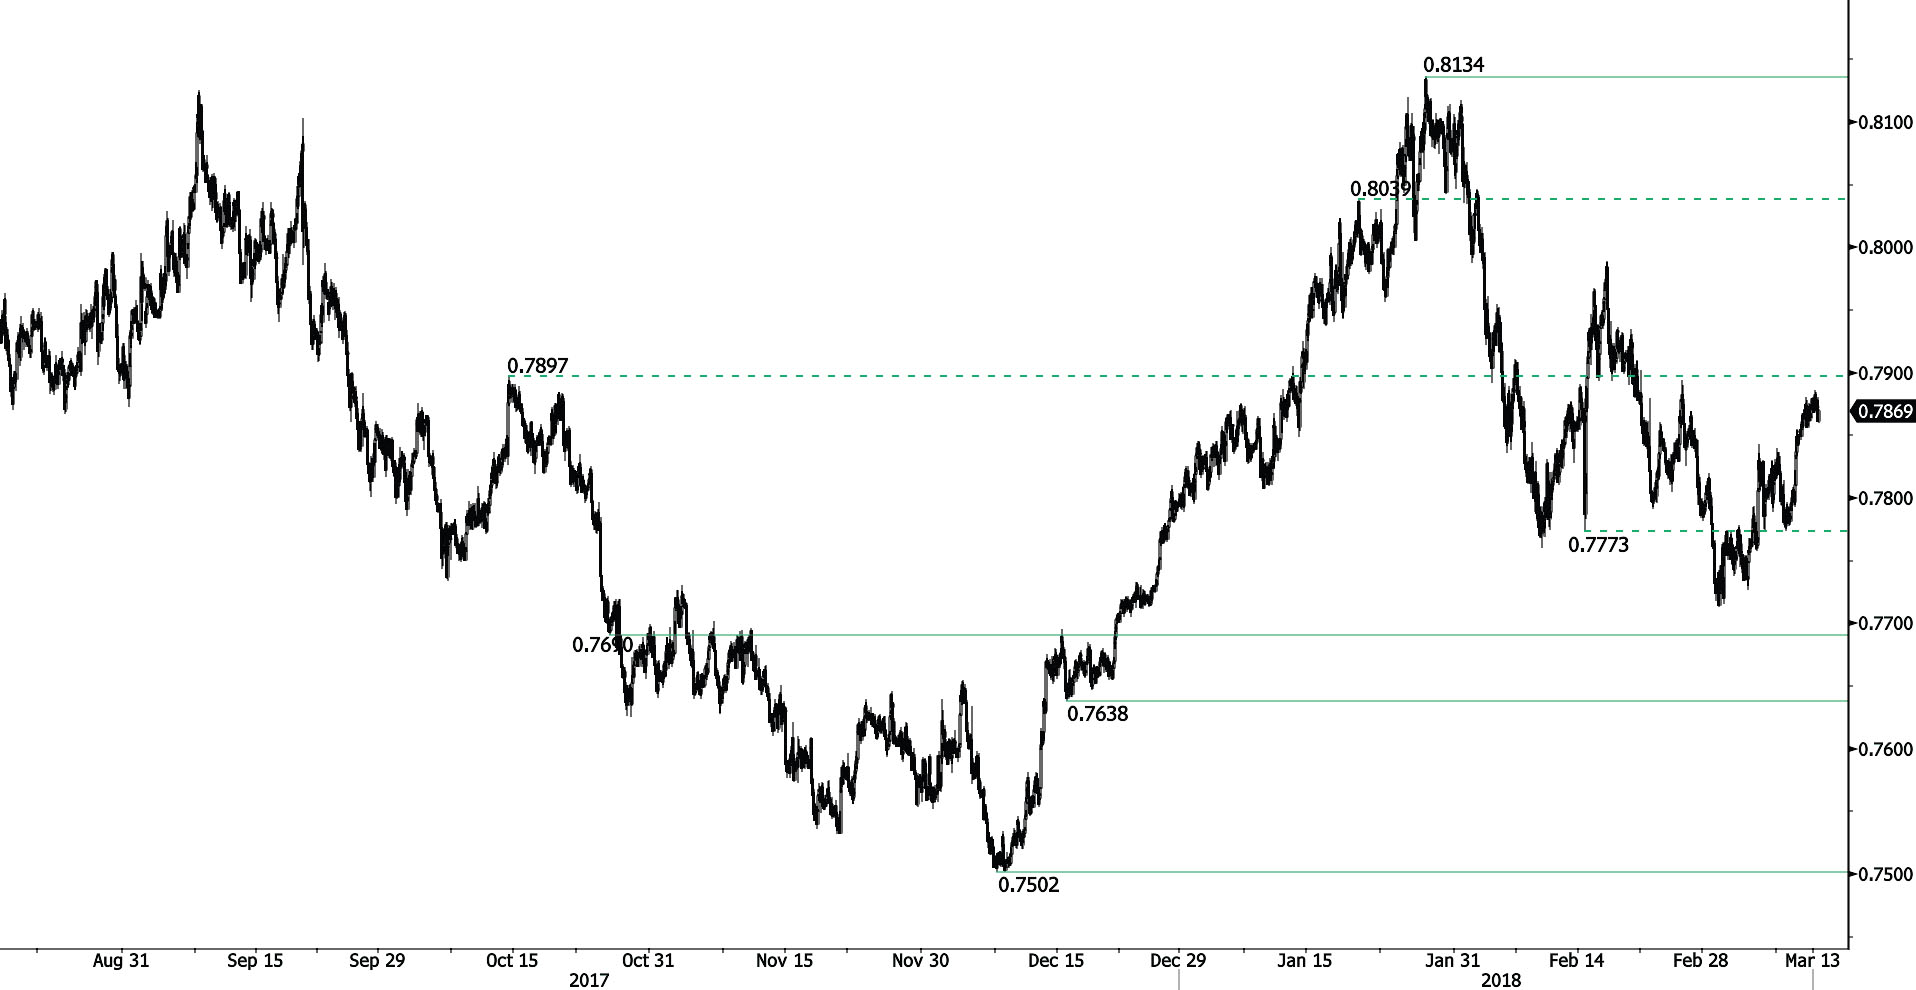
AUD/USD Bearish Pause
AUD/USD's momentum is fading. Hourly support is given at 0.7879 (21/02/2018 high). Further support and resistance are given at 0.7638 (15/12/2018 low) and 0.7999 (17/01/2018 high). The technical structure suggests shortterm upward moves.
In the long-term, the upward trend slows down after failing to reach key resistance at 0.8164 (14/05/2015 low). Key support stands at 0.6009 (31/10/2008 low). A break of the key resistance at 0.8164 (14/05/2015 high) is needed to invalidate our long-term bearish view.
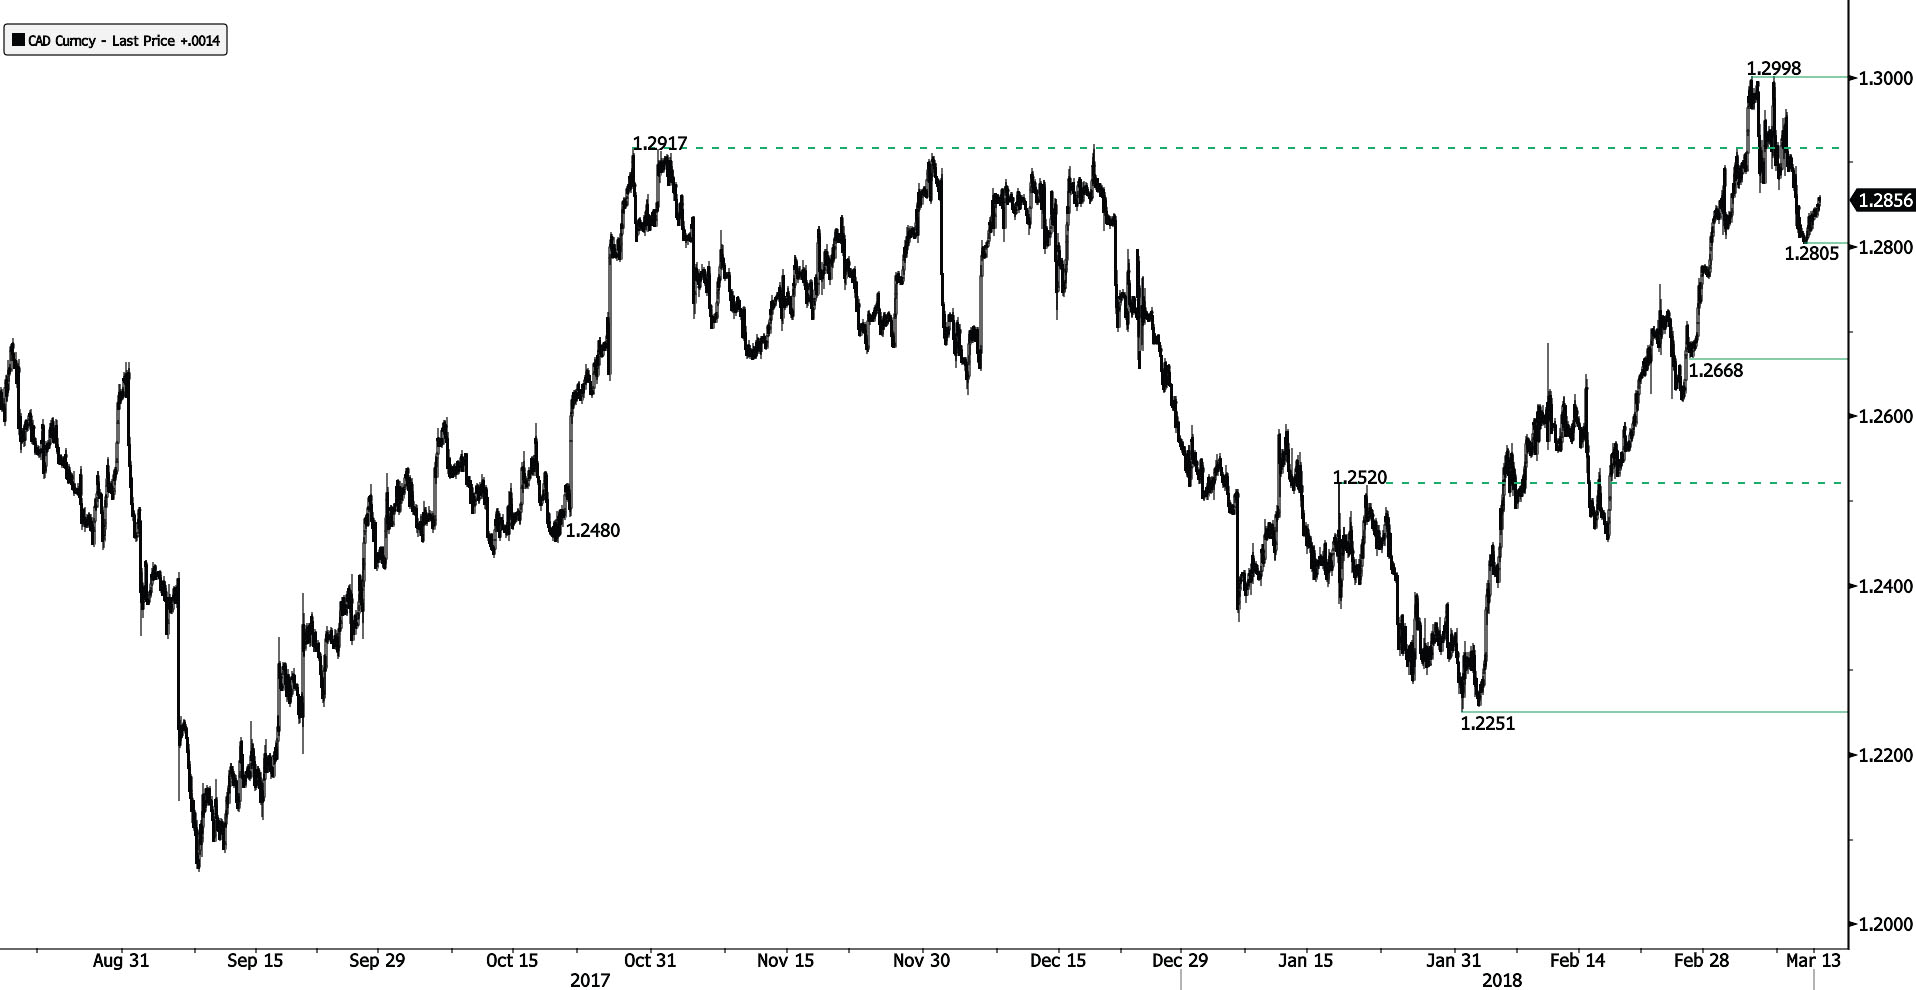
USD/CAD Recovery Bounce
USD/CAD has bounced off 1.2805 low. The pair is contained between hourly support and resistance at 1.2668 (26/02/2018 low) and 1.3015 (05/07/2018 high). The short-term technical structure suggests further short-term sideway moves.
In the longer term, the pair is trading between resistance point at 1.3805 (05/05/2017 high) and support at 1.2128 (18/06/2015 low). Strong resistance is given at 1.4690 (22/01/2016 high). The pair is likely to head lower. The pairs is trading above its 200 DMA
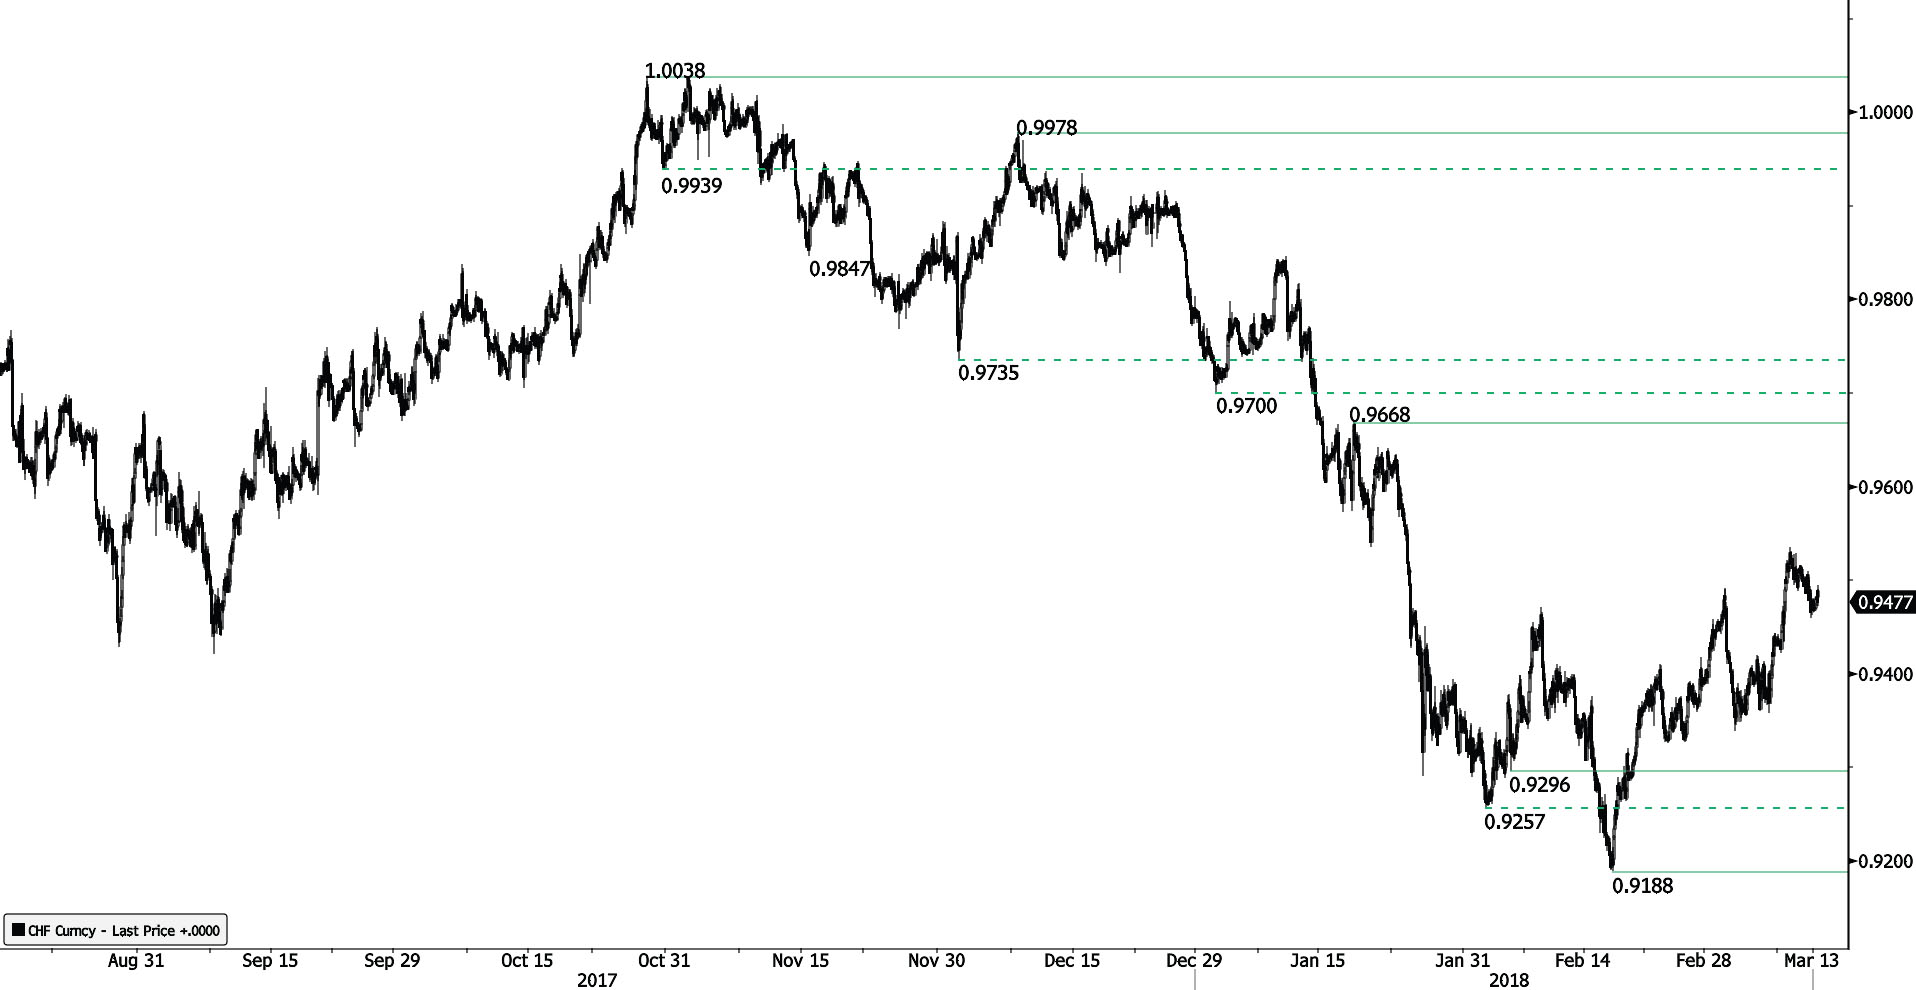
USD/CHF Trying To Bounce
USD/CHF is showing further signs of bearish pressure. The pair currently trades between hourly support and resistance at 0.9296 (05/02/2018 low) and 0.9559 (24/01/2018 high). Expected to show short-term increase.
In the long-term, the pair is still trading in range since 2011 despite some turmoil when the SNB unpegged the CHF. Key support lies at 0.9072 (07/05/2015 low) while resistance at 1.0344 (15/12/2016 high) is distanced. The technical structure favours a long term bullish bias since the unpeg in January 2015.