Sample Category Title
Elliott Wave Analysis: EURAUD, Bund And EURUSD
As stocks moved higher we saw a slow down on euro which in fact can be pointing lower based on negative correlation with German bunds that are pointing higher as recent set-back can be wave four. If that is the case then EURUSD can slip back below 1.2300.
BUND vs EURUSD
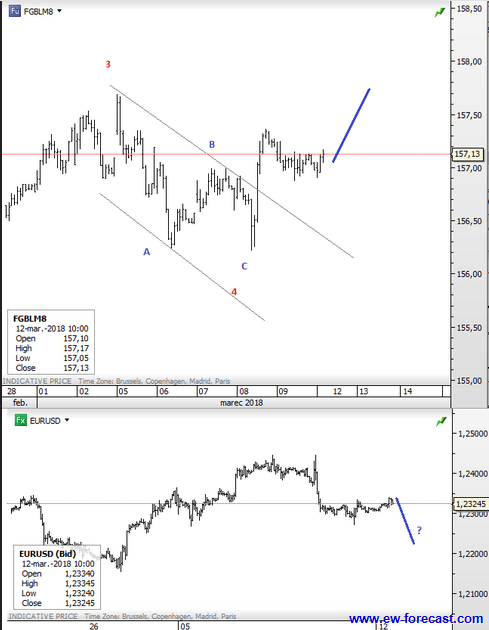
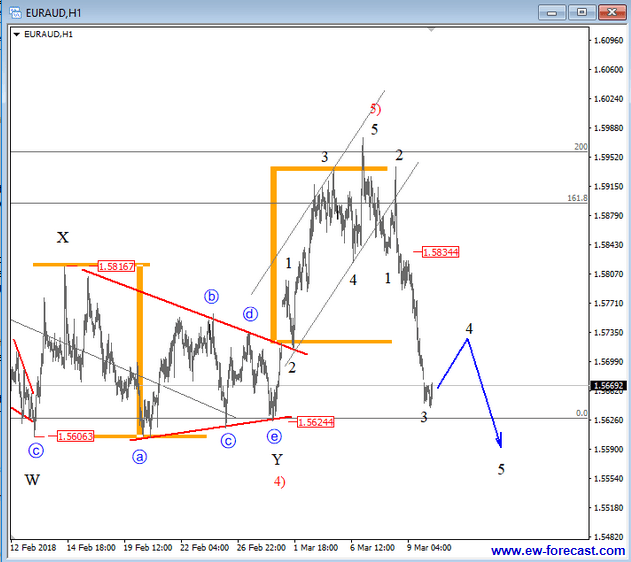
EURAUD suggest weaker euro during risk-on sentiment which can drop below 1.5600 this week, but most-likely after wave 4 rally.
EURAUD, 1H
GBP/USD Cup With Handle Bullish Pattern For Uptrend Continuation
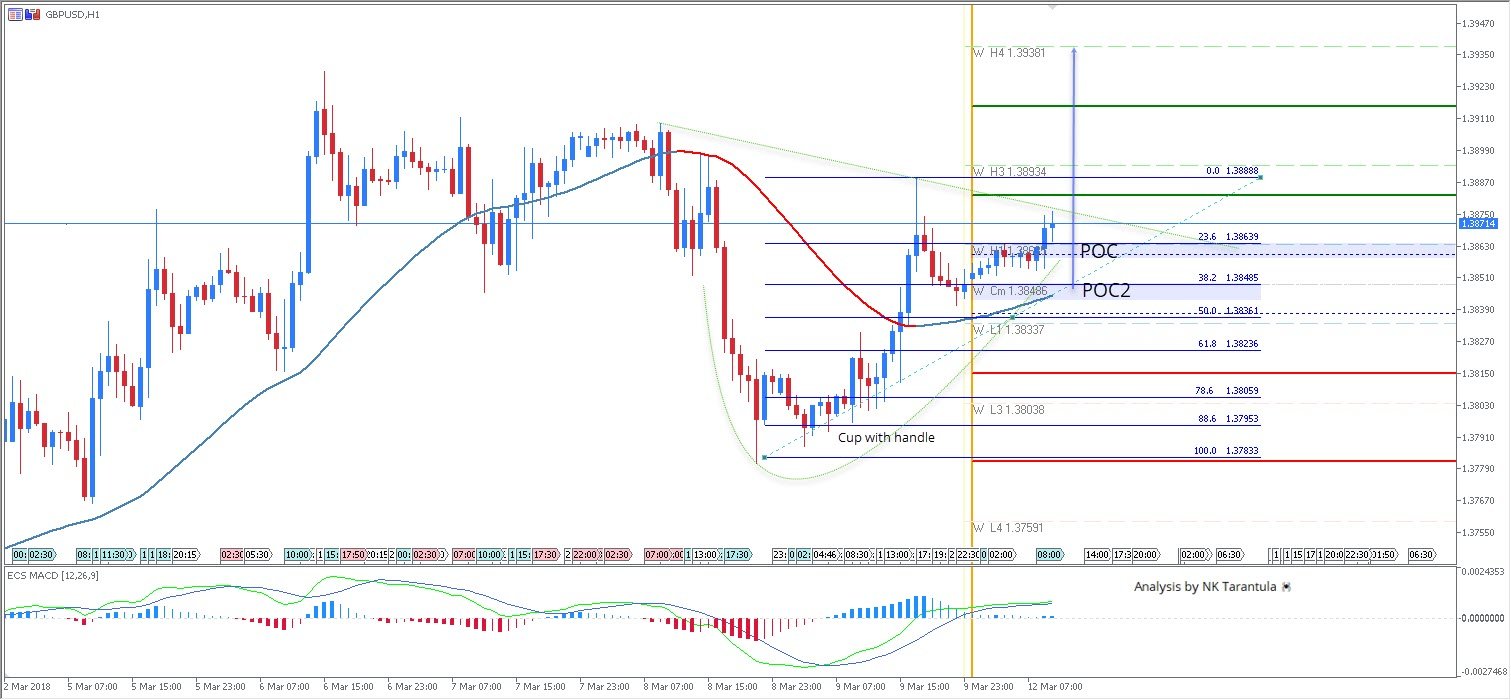
The GBP/USD has formed a Cup with Handle bullish pattern that suggests a possible uptrend continuation. We could see a bounce from 1.3860-70 zone and 1.3848 if retracement is slightly broader. For bulls to remain in control, the best would be that price is held above 1.3835-40 zone. Targets are 1.3893 and 1.3938. However its so-called 'NFP' Monday today so it's good to use the lower risk than usual when trading.
W H3 -Weekly Camarilla Pivot (Weekly Interim Resistance)
W L3 - Weekly Camarilla Pivot (Weekly Interim Support)
W H3 - Weekly Camarilla Pivot (Weekly Interim Resistance)
W H4 - Weekly Camarilla Pivot (Strong Weekly Resistance)
D H4 - Daily Camarilla Pivot (Very Strong Daily Resistance)
D L3 – Daily Camarilla Pivot (Daily Support)
D L4 – Daily H4 Camarilla (Very Strong Daily Support)
POC - Point Of Confluence (The zone where we expect price to react aka entry zone)
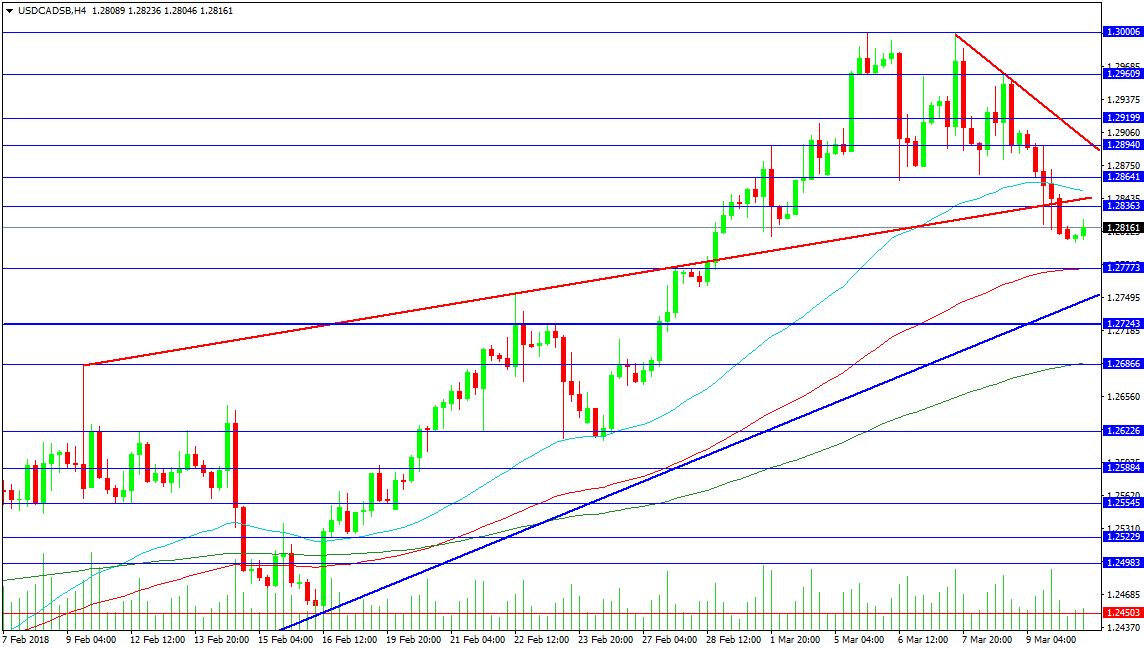
Forex Analysis: USDCAD And EURGBP
The USDCAD pair has risen to test 1.30000 in recent sessions and has dropped back to test support at 1.28000 as a backstop. As price is caught between these areas, there is a chance we stay in the range until energy is gathered and a direction is found. The trend has been higher during recent weeks, so the bias longer-term is for a resumption of that move. However, the 1.30000 area remains an obstacle and one that the market may find difficult to surpass. At present, it is defended by resistance at 1.29600 and 1.29200, with the 1.29000 level below, which are all seeing interest from sellers. The 1.28940 has proved resistive on the way up and on the way down on this chart, with the 1.28640 area halting moves on a number of occasions. The 1.28400 zone contains the 50-period MA and the rising trend line and this remains the first hurdle to overcome on any move higher.
Support can be found at 1.28000 as mentioned earlier, with the 1.27773 level combing with the 100-period MA today. Below is trend line resistance at 1.27450 and the February 22nd high. Further support is located at 1.27243, with the 200-period MA and the February 9th high at 1.26866. A drop under this area targets supports at 1.26226 and 1.25545.
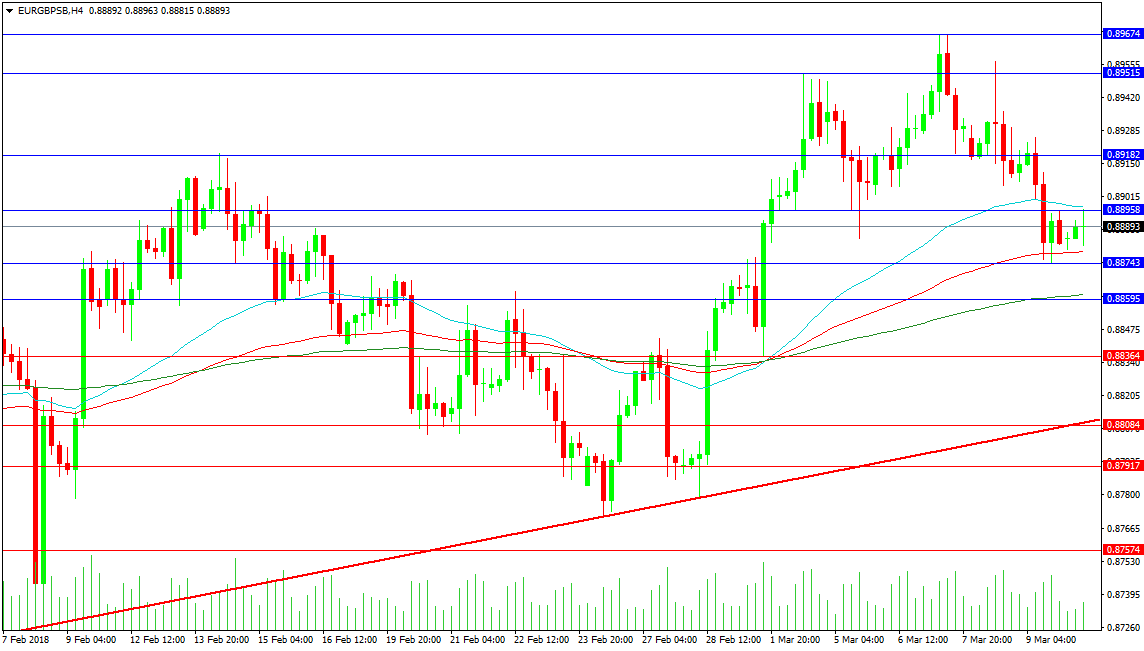
EURGBP
This pair has also dropped back from resistance at 0.89675 and has found support at 0.88743. Price is currently trading between the 50-period MA at 0.88973 and the 100-period MA at 0.88790. Resistance above this area can be found at 0.89182, which is the high from February 14th, followed by 0.89515, which is the March 2nd high. A push above the recent highs would test the 0.90000 area, with strong resistance in play up to 0.90316.
Support can be found at 0.88743, as mentioned, but the drop back under 0.89000 will trouble anyone looking for a push higher. The price has failed to stay above that level on six occasions since November and has continued to trade in a downward sloping sideways range. Support below can be seen at the 200-period MA at 0.88615, followed by 0.88364, which is becoming stronger and may be enough to halt any downward move, or at least slow it significantly. Further major support comes from the rising red trend line at 0.88100 and the 0.88000 level. This trend line is the main supportive element on the chart and a failure here can see price fall as far as 0.87000 or more likely 0.86000.
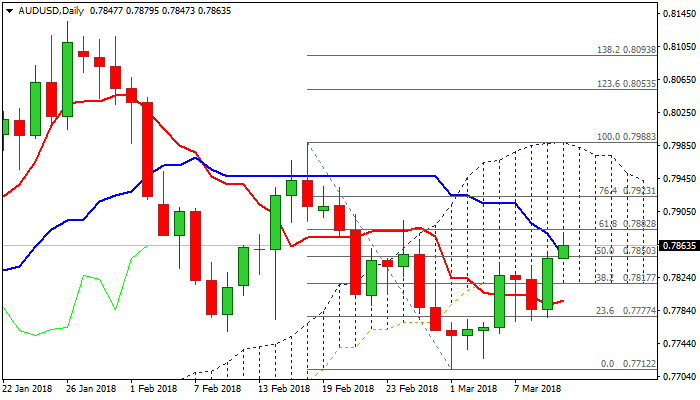
Technical Outlook: AUDUSD Moves Deeply In Daily Cloud And Pressures Pivotal Fibo Barrier At 0.7882
The Australian dollar remains firm on Monday, driven by fresh weakness of the greenback after US jobs data disappointed expectations for stronger pace of increasing US interest rates this year. Extension of Friday's strong rally, after repeated downside attempts were contained by 100SMA and formed a higher base at 0.7771, generated bullish signal on eventual break and close above the tops of three-day congestion. Fresh bulls extended in the middle of thick daily cloud and spiked near pivotal barrier at 0.7882 (Fibo 61.8% of 0.7988/0.7712 descend / 55SMA). Daily techs are improving as MA's are turning into bullish configuration and 14-d momentum is heading north, on track to break into positive territory and underpin near-term action. Close above 0.7882 is needed to confirm bullish continuation towards 0.7923 (Fibo 76.4%) which would expose key near-term barrier at 0.7988 (daily cloud top / 16 Feb high). The notion is supported by last week's bullish engulfing which signals stronger recovery. However, bulls are showing hesitation ahead of 0.7882 pivot and may hold in extended consolidation before moving higher. Broken 20SMA (0.7837) and daily cloud base (0.7817) mark solid supports which are expected to hold and keep fresh bulls intact.
Res: 0.7862, 0.7882, 0.7923, 0.7935
Sup: 0.7847, 0.7836, 0.7817, 0.7793
Markets Buoyed By Jobs Data As Trump’s Softening Tariff Stance
US equity markets are on course to open around half a percentage point higher on Monday, adding to Friday’s gains which came following an encouraging jobs report for February.
The numbers we saw on Friday provided the perfect balance of strong job creation and softer wage growth which does not necessarily trigger faster rate hikes. The much higher participation rate was a clear reminder that, while unemployment is at a 17-year low, there is still some slack in the economy which may take longer to sort out and explain why wage growth and inflation is so muted.
This is why we didn’t see the kind of knee jerk reaction in the markets that we saw a month ago. Policy makers will likely be looking at the data and see it as evidence that slack still remains and no additional tightening is needed as a result of the strong employment gains. Of course, this is just one jobs report and future reports could show stronger wage growth but for now, investors are comfortable with the numbers.
Another apparent softening in Donald Trump’s stance on trade tariffs is also providing a small boost to sentiment this morning. Trump is clearly using these tariffs to force the hand of those allies that he believes are taking advantage of the US. Whether this is the best way to get more cooperation is another matter but investors are becoming more encouraged by his recent acknowledgement that a reduction could be imposed for some countries.
This week is looking a little quieter than the last couple but there are some notable things that traders will have an eye on. The inflation and retail sales data from the US over the next couple of days stands out, particularly following those jobs numbers on Friday. Tomorrow’s CPI number isn’t the Fed’s preferred measure but, coming a week before the March Fed meeting when another rate hike is expected, as well as new economic projections, it will be monitored very closely.
BTC Recovers Slowly, Trump Trade Tariffs In Focus
Cryptos cought up in the cross fires
The crypto market recovers slowly after last week correction, which wiped off $132 billion in valuation. The price of Bitcoin bounce back 14%, from $8,368 last Friday to around $9,550 on Monday morning. However, the momentum is fading as crypto-assets, particularly Bitcoin, is facing more and more hurdles to the broad adoption of cryptocurrencies as mean of payment.
Crypto exchanges across the planet are facing conditions that are more challenging as governments, credit card issuers and local banks keep throwing up roadblocks. Banks are making increasingly difficult for crypto exchanges to access their services. Recently, the Finnish broker Prasos found itself in a complex situation as four banks (out of five), with which Prosas is working to convert crypto to fiat currencies (in this case euro), ended their business relationship amid fears of money laundering.
Last week, the Securities and Exchange Commission (SEC) announced that any exchange, including crypto-exchanges, has to comply with SEC rules. The news triggered a sharp sell-off that affected the entire crypto-market. Even though the regulation of crypto-assets will eventually have positive effects for investors in the long-term - such as a lower volatility - the drop in price suggests that investors are not convinced of those long-term advantages. Indeed, it could been seen as a way to delay the adoption of blockchain based solutions, especially as a mean of payment.
Indeed, banks' business model is put in jeopardy by the blockchain technology and most them are not ready to compete with it right know. Therefore, they need to buy time and excluding crypto exchanges from the banking system is an easy way to do it.
Donald Trump threatens European automotive industry
Threatening Europe, China and Japan aluminum (10%) and steel industries (25%) after implementing heavy tariffs, Donald Trump is now focusing on one of Europe's flagship industry following infructuous discussions of both European and US negotiators in Brussels, aiming at exempting European industries from potential US taxes. Hammering his intentions to “tax Mercedes-Benz, BMW and other German automotive companies if no effort is made to remove tariff barriers for US products, American First President is putting into question the legitimacy of his measures due to decent country diversifications of these multinationals, pushing his unilateral decisions in opposition to WTO fundamentals. On Asian side, China clearly confirmed its willingness to continue discussions with US negotiators while defending its interests at all cost.
Impact of US tariffs on the market remained subdued, as investors start to minimize Trump's market threatening due to inconsistencies provided from its plan changes. Asian markets were rallying in the green boosted by strong US February NFP data given at 313'000 (consensus: 205'000). Hong Kong Hang Seng and Shanghai Composite were both expanding by +1.86% and +0.59% while Japanese Nikkei 225 gained 1.65%.
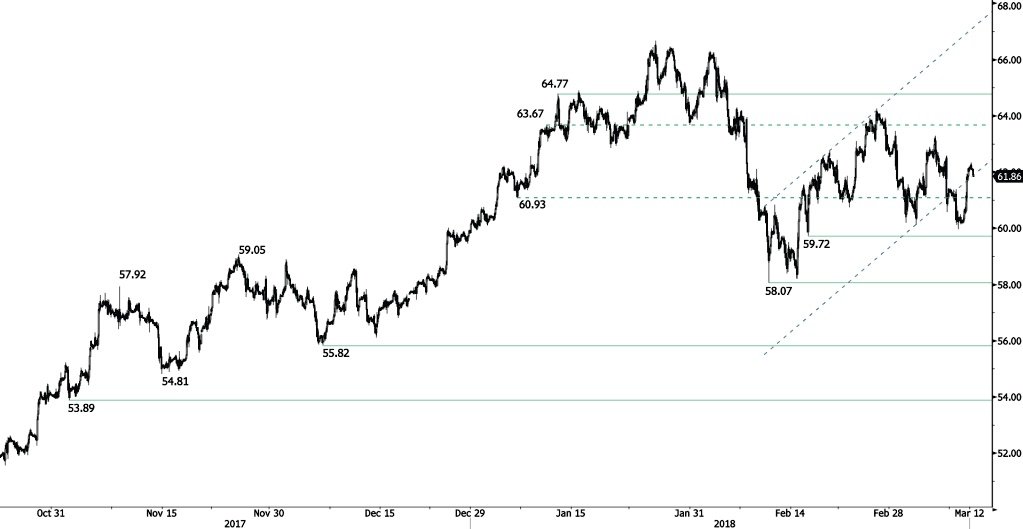
CRUDE OIL Decreasing
Crude oil upward trend stops following its rise at 62.33, heading for the 61.50 range. Hourly support and resistance remain at 59.72 (15/02/2018 low) and 64.77 (11/01/2018 high). The technical structure suggests short-term decrease.
In the long-term, crude oil has recovered after its sharp decline last year. However, we consider that further weakness is very likely. For the time being, the pair lies in an upside trend since June 2017. Support lies at 42.20 (16/11/2016) while resistance is located at 77.83 (20/11/2014). Crude oil is trading largely above its 200 DMA.
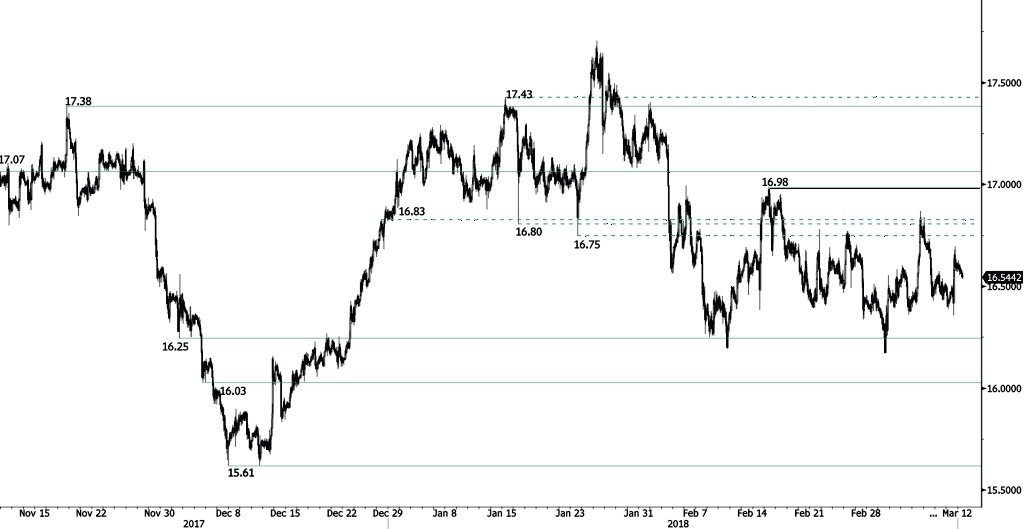
SILVER Declining
Silver selling pressures have started, the pair is heading along the 16.45 range. The pair is contained between hourly support and resistance given at 16.25 (12/01/2018 low) and 16.98 (15/02/2018 high). The short-term technical structure suggests further short-term decrease.
In the long-term, the trend remains negative/ sideways. Further downside is very likely. The pair is trading below its 200 DMA. Resistance is located at 21.58 (10/07/2014 high). Strong support can be found at 11.75 (20/04/2009).
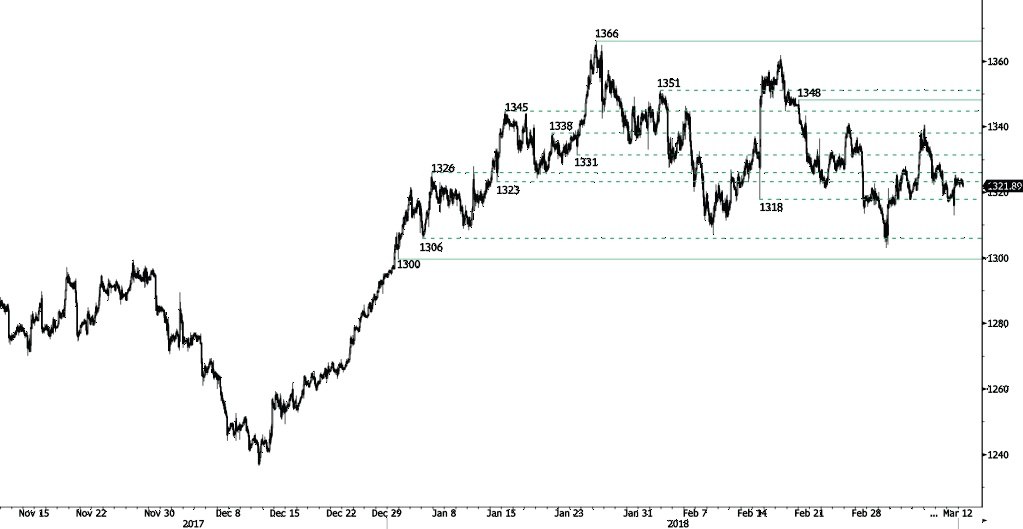
GOLD Bouncing Back
Gold starts a recovery phase, trading along the 1322 range. The pair is ready for another leg lower, approaching the 1325 range. The pair is contained between hourly support and resistance at 1300 (29/12/2017 low) and 1348 (20/02/2018 high). Expected to show further increase.
In the long-term, the technical structure suggests that there is a growing upside momentum. A break of 1'392 (17/03/2014) is required to confirm it. A major support can be found at 1'045 (05/02/2010 low).
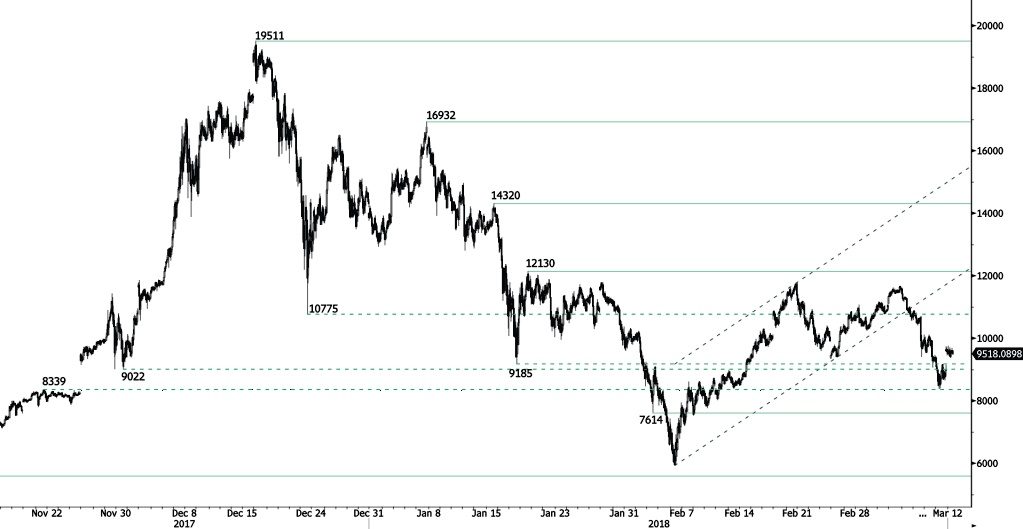
BITCOIN Slight Recovery
Bitcoin bounces back following its decline at 8368 and approaches the 10000 range. Expected to show short-term strength. Bitcoin is contained between hourly support and resistance at 7614 (02/02/2018 low) and 12130 (18/01/2018).
In the long-term, the digital currency has had an exponential growth but also presented important downturns. There is decent likelihood that the currency could stabilize between 7'000 - 12'000 in 2018. Bitcoin is approaching its 200 DMA (7000 range).