Sample Category Title
EU Malmström sought clarity, Trump warned “we TAX CARS”
European Commissioner for Trade Cecilia Malmström met U.S. Trade Representative Robert Lighthizer over the weekend to seek clarity on the steel and aluminum tariffs of the US. However, Malmström expressed her frustrations afterwards complaining that the meeting delivered "no immediate clarity". She tweeted "As a close security and trade partner of the U.S., the EU must be excluded from the announced measures. No immediate clarity on the exact U.S. procedure for exemption however, so discussions will continue next week."
German Economy Minister Brigitte Zypries also warned that "Trump's policies are putting the order of a free global economy at risk." And, "he does not want to understand its architecture, which is based on a rule-based system of open markets. Anyone, who is questioning this, is jeopardizing prosperity, growth and employment."
However, Trump stepped up his rhetoric again as he tweeted "the European Union, wonderful countries who treat the U.S. very badly on trade, are complaining about the tariffs on Steel & Aluminum." He added "if they drop their horrific barriers and tariffs on U.S. products going in, we will likewise drop ours. Big Deficit. If not, we Tax Cars etc. FAIR!"
Market Morning Briefing: Gold Bounced Back From Support Near 1310
STOCKS
Overall major stock indices are trading higher.
Dow (25335.74, +1.77%) moved up in line with our expectation and may test immediate resistance near 25500. If that holds, a short dip back towards 25000-24500 is possible else a break above 25500, if seen could be bullish for the index towards
26000 or higher in the medium term.
Dax (12346.68, -0.07%) is almost stable below 12400. While resistance near 12400/500 holds, a fall towards 12200 or lower is possible.
Nikkei (21803.93, +1.56%) is trading just near immediate resistance levels and in case that holds, a short dip is likely in the coming sessions towards 21400-21000. Else a rise above current levels, if seen could take the index higher towards 22600 in the coming sessions.
Shanghai (3326.72, +0.59%) has resistance near 3350 on the 3-day candles and is likely to test that in the next few sessions before coming off from there. Immediate view is bullish within a bearish outlook for the medium term.
While below 10380, Nifty (10226.85, -0.15%) may come off towards 10080-10020 as we have been mentioning for quite sometime. Thereafter a bounce back towards 10320-10380 levels is possible.
Sensex (33307.14, -0.13%) is likely to test 33750 in the near term before coming off from there back towards 33000. Overall range trade is likely to continue for some time.
COMMODITIES
Brent (65.61) and WTI (62.15) have risen well. But note immediate resistances near 66.0-66.5 and 62-63 may limit further upside just now. Trade is expected within 66.50-62 and 63-60 region for the near term.
Gold (1323.60) bounced back from support near 1310 and while that holds the price is likely to trade within 1310-1340 region in the coming sessions.
Copper (3.1345) rose sharply from levels just above 3.05 and while the rise sustains, the price could move up towards 3.17-3.20 in the next couple of sessions. Near term looks bullish.
FOREX
Euro (1.2320) : Draghi's dovish stance in the 8th March press conference and the downward revision of forecasted inflation in 2019 caused the Euro to weaken below 1.24 and it saw a low of 1.2273 on Friday. It is respecting support on weekly candles near 1.228-1.23, but there is some likelihood for it to see a further downmove towards support on daily candles near 1.225 and then bounce from there back towards 1.25-1.26.
The Dollar Index (90.023) saw a bounce from support near 89.5 on daily candles last week after the ECB chief's dovish stance in the press conference. We were expecting the Bank of Japan's meeting on Friday to impact the Dollar – however, the BOJ maintained status quo and the Dollar Index hasn't seen any significant movement since then. As mentioned previously, it has immediate resistance visible on the daily candles near 90.5. If breached, there is higher resistance near 91 on 3 day and weekly line charts. In case of a dip (less preferred) from current levels, the next downside target is 89.75 on daily candles.
Dollar-Yen (106.61) as mentioned on Friday, seems to be respecting immediate resistance near 107 on the daily line charts provided by 13 days and 21 days moving average lines. The Bank of Japan meeting on Friday maintained status quo and didn't cause any significant impact on Yen strength . Dollar Yen in this week could again move down towards 105.5, which is a crucial support and a break of which would lead to medium term bearishness.
The Euro-Yen (131.33) looks likely to move down towards support near 129.75-129.50 seen on daily and 3 day candles in this week. If the Dollar Yen and Euro indeed test supports near 105.5 and 1.225, the corresponding rate for Euro Yen would be 129.23, which would be consistent with the predicted downmove towards support on the Euro yen daily chart.
As per expectation, strong support for the Pound (1.3857) near 1.38 has held and it is now seeing an upmove towards 1.395 (seen as immediate resistance level on daily candles).
Dollar-Rupee (65.17): Dollar-Rupee remains in an overall uptrend. A rise past 65.20 can take the market up to 65.40+.
INTEREST RATES
The Bank of Japan maintained its policy stance unchanged in the Friday meeting, causing no impact to bond yields or forex rates. Infact the Japan 10 Yr yield (0.05%) had bounced from support near 0.038% on the short term chart prior to the BOJ meeting in anticipation of some hawkishness by the central bank. However, with no such development and the BOJ's commitment to maintain the yield rate around the 0% level, it might again move down towards 0.04% in the coming weeks.
The German 10 Yr – US 10 Yr is currently at support near -2.26% on the long term chart and might bounce in this week via a slight dip in US yields.
US 10 Year Yield (2.9011), US 30 year Yield (3.1647), US 5 year yield (2.6621), US 2 year yield (2.2661) : We have been saying that a rise in US yields beyond long term resistance levels is imminent in March. However, last week, we also said that there might just be some drop in US yields in this week, after which the week of the US Fed meeting might then see volatility return, taking yields higher in anticipation of a rate hike. We might be wrong since yields have gone up by 2-3 basis points on average since Friday. We will have to wait and watch to see how the next few days pan out. (Long term resistance levels for the 4 yields have been as follows: 2.85-2.90, 3.20, 2.7 and 2.2 respectively – a decisive breach of these levels could happen in March 2nd half.)
Can EUR/USD Recover Above 1.2370?
Key Highlights
- The Euro declined after trading towards the 1.2450 resistance against the US Dollar.
- There is a key connecting bearish trend line forming with resistance at 1.2400 on the 4-hours chart of EUR/USD.
- The US nonfarm payrolls figure posted a solid rise of 313K in Feb 2018, more than the forecast of 200K.
- Today, the US monthly budget for Feb 2018 will be released, which is forecasted to post $-222.6B.
EURUSD Technical Analysis
The Euro traded higher this past week above the 1.2400 level against the US Dollar. However, the EUR/USD pair could not move above 1.2450 and started a downside move.
The pair made a double top pattern near the 1.2445 level and declined. It moved below the 38.2% Fib retracement level of the last wave from the 1.2151 low to 1.2446 high.
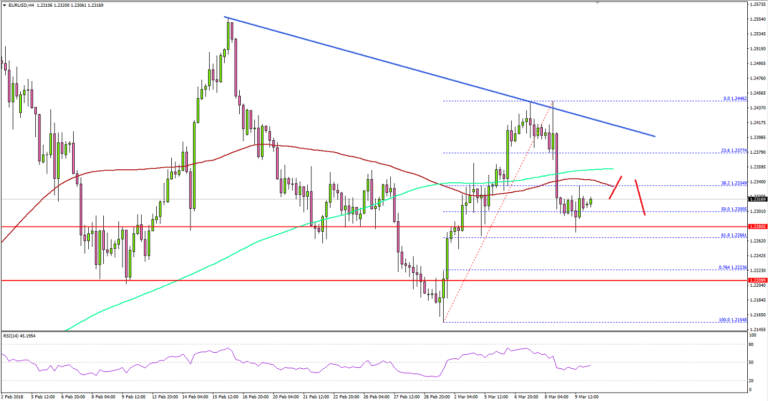
More importantly, there was a close below the 1.2400 support and the 100 simple moving average (red, 4-hour). The pair remains under a bearish pressure and it could decline further towards 1.2250.
A major support is near the 61.8% Fib retracement level of the last wave from the 1.2151 low to 1.2446 high. Below 1.2260 and 1.2250, the pair may retest the 1.2200 support.
On the upside, there is a key connecting bearish trend line forming with resistance at 1.2400 on the 4-hours chart. A break above the trend line resistance is needed for the pair to move back towards 1.2450.
This past Friday, the US nonfarm payrolls report for Feb 2018 was released by the US Department of Labor. The market was looking for a rise of 200K, similar to the last reading.
However, the actual result was better as there was a rise of 313K. The last reading was also revised up from 200K to 239K. Moreover, the unemployment rate remained stable at 4.1%.
The report added:
Among the major worker groups, the unemployment rate for Blacks declined to 6.9 percent in February, while the jobless rates for adult men (3.7 percent), adult women (3.8 percent), teenagers (14.4percent), Whites (3.7 percent), Asians (2.9 percent), and Hispanics (4.9 percent) showed little change.
The overall sentiment is positive for the US Dollar, which is why the EUR/USD pair may remain in a bearish trend.
Economic Releases to Watch Today
US Monthly Budget for Feb 2018 – Forecast $-222.6B, versus $49.0B previous.
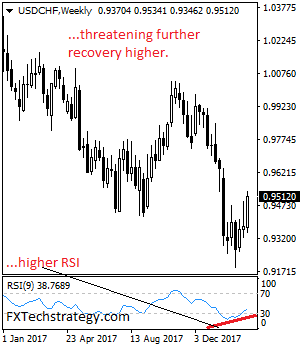
USDCHF – Looks To Strengthen Further On Correction
USDCHF - With the pair retaining its recovery pressure the past week, more gain is likely. On the downside, support lies at the 0.9450 level. A turn below here will open the door for more weakness towards the 0.9400 level and then the 0.9350 level. On the upside, resistance resides at the 0.9550 level where a break will clear the way for more strength to occur towards the 0.9600 level. Further out, resistance comes in at the 0.9650 level. Above here if seen will turn attention to 0.9700. All in all, USDCHF faces further downside pressure.
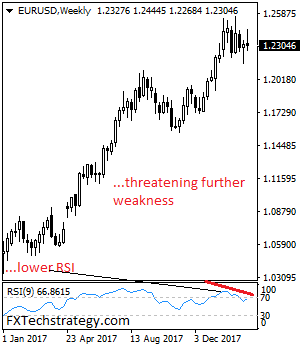
EURUSD – Remains Vulnerable On Correction
EURUSD - With the pair retaining its corrective pullback threats, more weakness is likely in the new week. On the upside, resistance comes in at 1.2350 level with a cut through here opening the door for more upside towards the 1.2400 level. Further up, resistance lies at the 1.2450 level where a break will expose the 1.2500 level. Conversely, support lies at the 1.2250 level where a violation will aim at the 1.2200 level. A break of here will aim at the 1.2150 level. Below here will open the door for more weakness towards the 1.2100. All in all, EURUSD faces further bear threats on correction.
Goldilocks Is Back At The Table
Goldilocks is back at the table
The strong payrolls growth in February which swept past all expectations were tempered by softer-than-expected average hourly earnings (AHE) reading leaving the market with a bit of dilemma as we near March FOMC forward guidance. On the surface, the headline was strong enough to shift their dot plot need, but there remains the begging the question about the fuller inflation prospects.
So wage growth remains muted – and with this week’s CPI unlikely do indicate a significant uptick in inflation, investors are left mulling over what this all mean for interest rates and specifically should they continue to move higher amid signs that lower taxes and higher public spending will most certainly lift short-term growth. Despite the positive economic narratives, the tepid wage growth suggests the Feds will be in little rush to move into the four rate hike camp.
Trumps trade agenda and the recent North Korea news continued to dot the weekend news flow.
The remarkable turn of events in North Korea has sent a wave of positivity through the region, but there remain many obstacles to overcome, but on the surface, any talk is a good talk between these political nemeses. Financial markets in South Korea have reacted positively to news of the meeting. The KOSPI and the WON improved cheered on by the prospects for the Tump -Kim meeting
On the tariff front, Australian Prime Minister Turnbull confirmed that Australia would be exempt from US steel and Aluminum tariffs.
Equity Markets
The best of both worlds for equity markets, with the economy in full swing but nary a sign of wage inflation. It doesn’t get much better than that for investors and at least for now have dampened the inflationary fears that weighed on investor sentiments in February.But when coupled with an easing in trade rhetoric and positive news from the Korean Peninsula, risk sentiment is powering higher.
Goldilocks returns at least for a day.
Oil Markets
Oil markets rallied sharply after the stellar US jobs reports which rocketed the S&P higher and in general sparked a wave of global risk-on trade. But oil traders are banking on the stronger than expected jobs reports to translate into higher oil product demand. Finally, oil bulls cheered on the Baker Hughes reports which indicated the number of oil drilling rigs fell by four to 796 last week.
Gold Markets
The markets are turning more neutral yet cognizant of upside risks. The US dollar, at least for now, is trading with a bit more swagger, Tumps trade and tariff rhetoric has eased, and with the US- North Korea meeting set to take place, investors are in a happier spot. With Goldilocks back at the table, at least for today, gold hedge appeal could be tempered near term.
Currency Markets
Japanese Yen
With positive risk sentiment gripping the markets and with USDJPY looking to squeeze a bit higher on the Goldilocks jobs report, positioning could take over. A good portion of the market remains short, but with risk sentiment looking very bubbly in early APAC, risk on could flush out some weaker hands sending USDJPY to the fundamental 107.30 level.
The Euro
Draghi, the master of illusion, has taken much of the top side momentum out of the Euro. The softer data flow and the overall dovish ECB take should cap strength over the near term.
The Australian Dollar
Lacklustre AHE but strong NFP favours the ‘goldilocks’ economy scenario so risk assets should remain bid which will underpin the Aussie dollar. Also, the AUD has a bit of a spring in its step after trim confirmed AUD tariff exclusion, but this was signalled last Thursday, so the Aussie dollar remains more of the risk play driven by external factors
The Malaysian Ringgit
Ultimately this risk on the environment will benefit the MYR, and while local assets are cheering on the prospects of improving North Korea -US relations. Currently, the market is caught between a stronger USDJPY and buoyant regional equity market with suggested we will trade within recent ranges.
The regional markets will closely monitor the progress of President Trump and North Korean leader Kim Jong Un summit as most certainly an easing of tension will be a boost to regional sentiment.
Oil prices rose after the US Non-farm payroll while being buffeted by buoyant risk sentiment and remain mildly supportive for the Ringgit.
EUR/USD Weekly Outlook
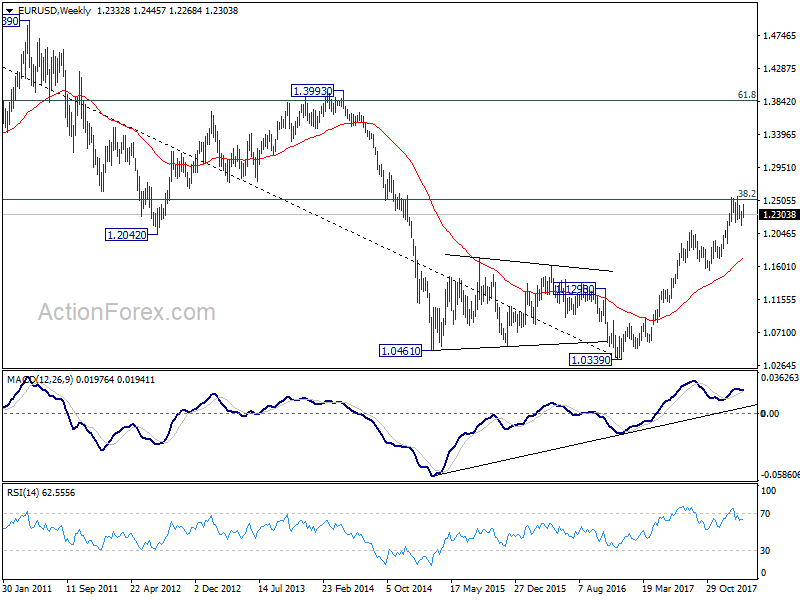
EUR/USD rebounded to 1.2445 last week but retreated sharply since then. However, downside is contained above 1.2268 minor support so far. Initial bias stays neutral this week first. On the downside, break of 1.2268 will argue that fall from 1.2555 is likely resuming. And intraday bias will be turned back to the downside for 1.2154 support and below. On the upside, above 1.2445will turn bias to the upside for retesting 1.2555 key resistance.
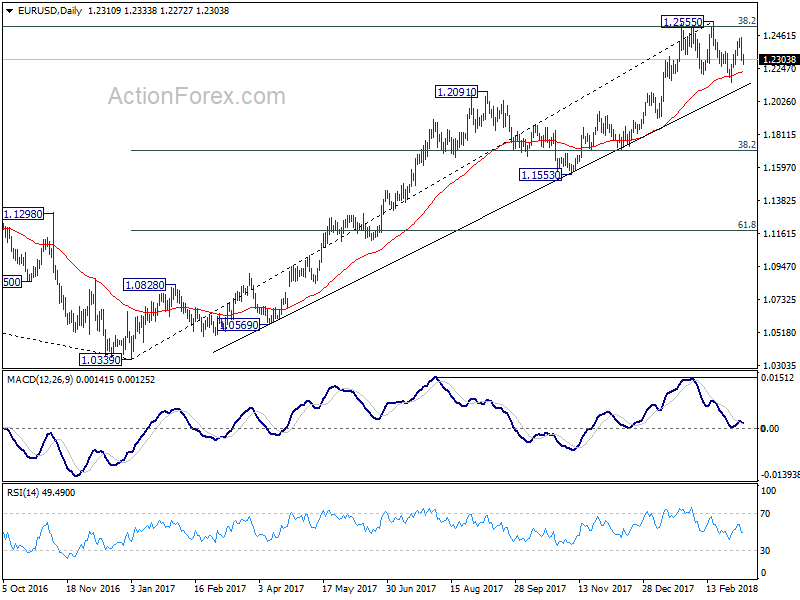
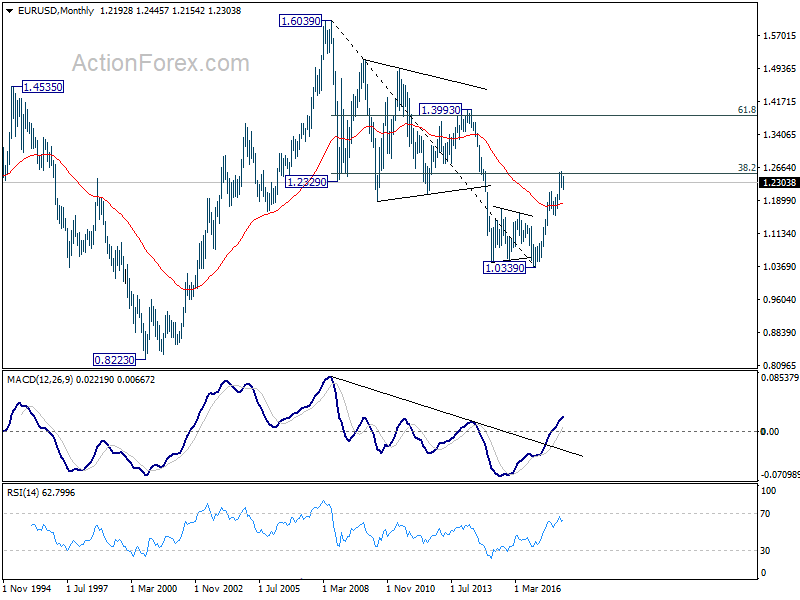
In the bigger picture, key fibonacci level at 38.2% retracement of 1.6039 (2008 high) to 1.0339 (2017 low) at 1.2516 remains intact despite attempts to break. Hence, rise from 1.0339 medium term bottom is still seen as a corrective move for the moment. Rejection from 1.2516 will maintain long term bearish outlook and keep the case for retesting 1.0039 alive. Firm break of 1.1553 support will add more medium term bearishness. However, sustained break of 1.2516 will carry larger bullish implication and target 61.8% retracement of 1.6039 to 1.0339 at 1.3862.
In the long term picture, 1.0339 is seen as an important bottom as the down trend from 1.6039 (2008 high) could have completed. It's still early to decide whether price action from 1.0339 is developing into a corrective or impulsive pattern. Reaction to 38.2% retracement of 1.6039 to 1.0339 at 1.2516 will give important clue to the underlying momentum.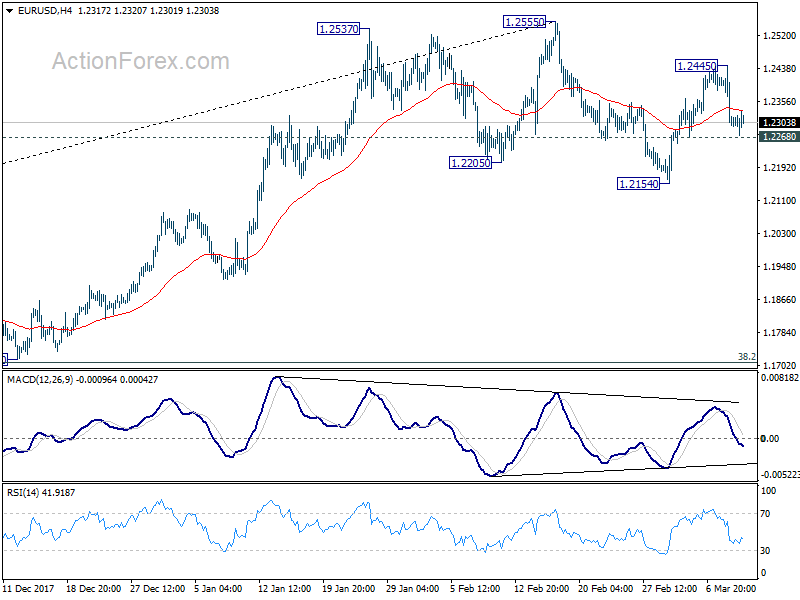
USD/JPY Weekly Outlook
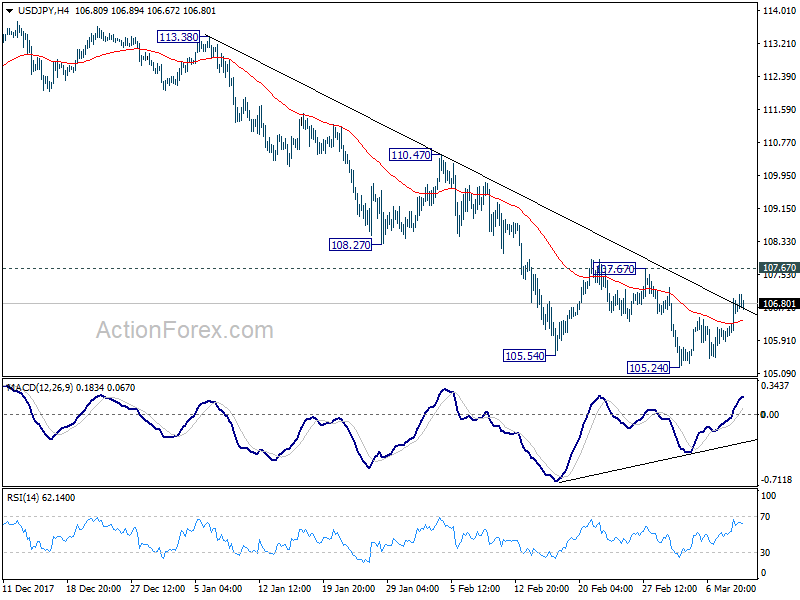
USD/JPY recovered last week and turned into consolidation above 105.24. Initial bias stays neutral this week first. Considering bullish convergence condition in 4 hour MACD, decisive break 107.67 resistance will indicate near term reversal. In such case, outlook will be turned bullish for 110.47 resistance next. But before that, another decline is still mildly in favor. Break of 105.24 will resume larger decline from 118.65 and target 100% projection of 118.65 to 108.12 from 114.73 at 104.20 next.
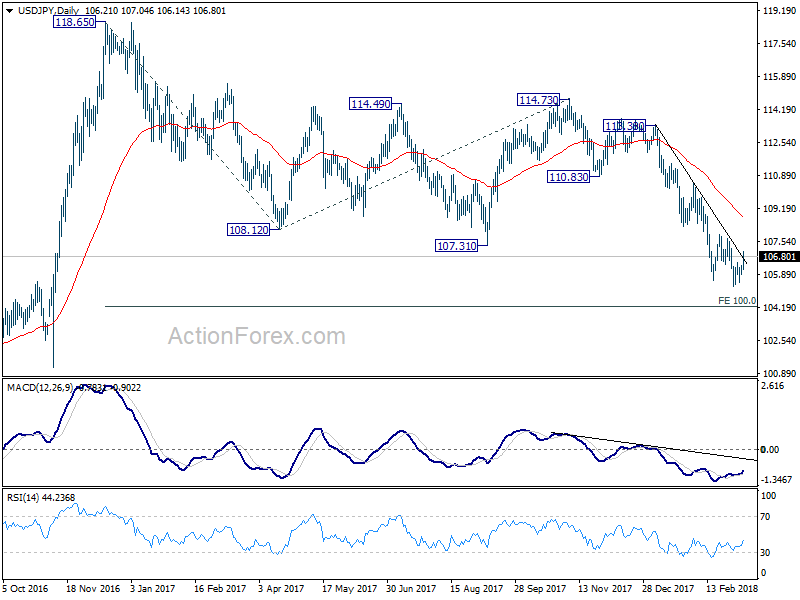
In the bigger picture, current development argues that the corrective pattern from 118.65 is extending. The solid break of 61.8% retracement of 98.97 to 118.65 at 106.48 now suggests that the pattern from 125.85 high is possibly extending. Deeper fall could be seen through 98.97 key support (2016 low). This bearish case will now be favored as long as 110.47 resistance holds.
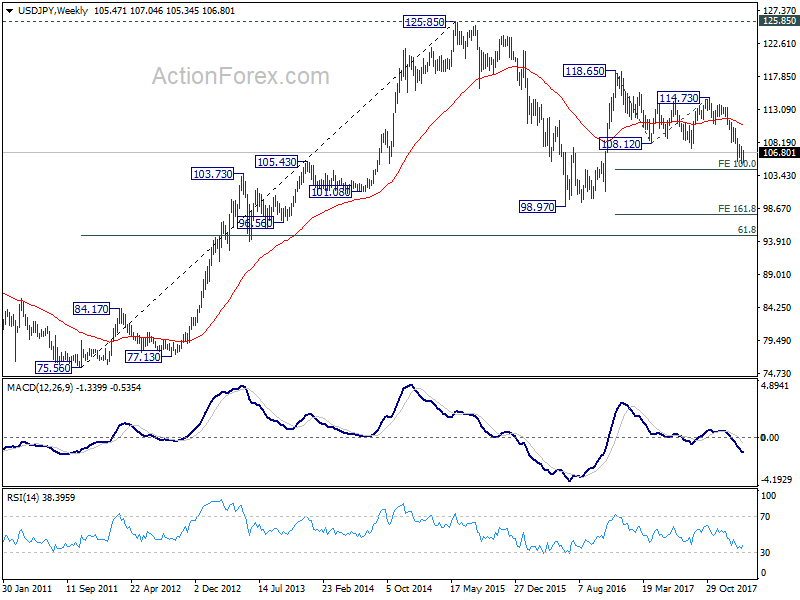
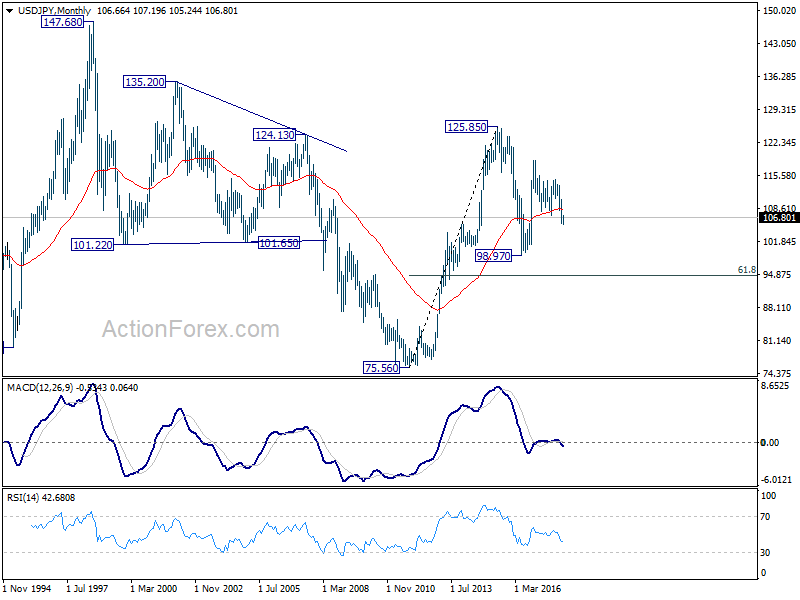
In the long term picture, the rise from 75.56 (2011 low) long term bottom to 125.85 top is viewed as an impulsive move, no change in this view. Price actions from 125.85 are seen as a corrective move which could still extend. In case of deeper fall, downside should be contained by 61.8% retracement of 75.56 to 125.85 at 94.77. Up trend from 75.56 is expected to resume at a later stage for above 135.20/147.68 resistance zone.
GBP/USD Weekly Outlook
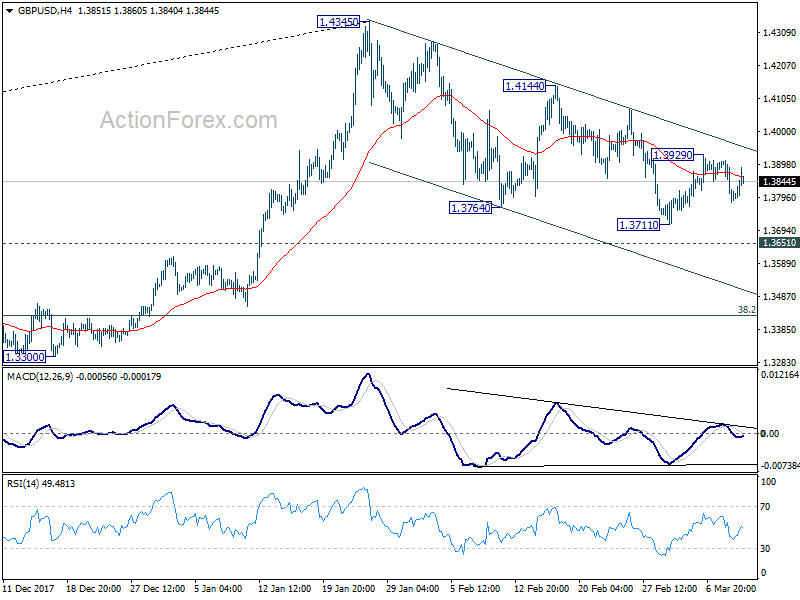
GBP/USD stayed in consolidation above 1.3711 last week and outlook is unchanged. Initial bias is neutral this week first and deeper fall is in favor. Break of 1.3711 will resume the decline from 1.4345 through 1.3651 resistance turned support. At this point, we'll look for strong support from 38.2% retracement of 1.1946 to 1.4345 at 1.3429 to contain downside and bring rebound. However, break of 1.3929 minor resistance will the first sign of near term reversal. Intraday bias will be turned back to the upside for 1.4144 resistance for confirmation.
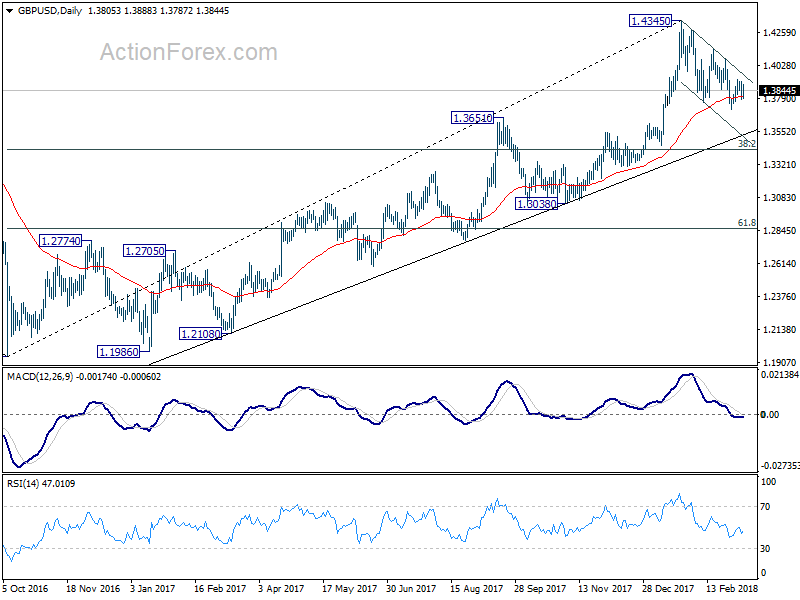
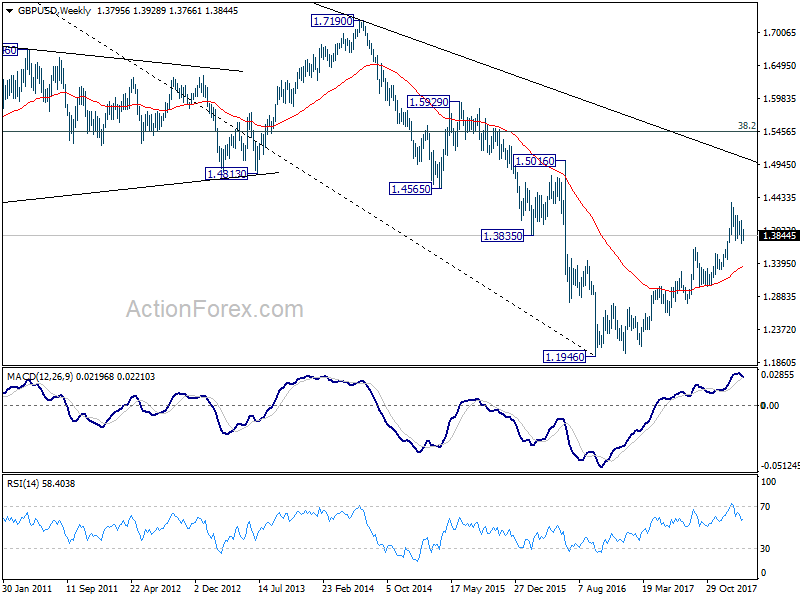
In the bigger picture, as long as 1.3038 support holds, medium term outlook in GBP/USD will remains bullish. Rise from 1.1946 is at least correcting the long term down from 2007 high at 2.1161. Further rally would be seen back to 38.2% retracement of 2.1161 (2007 high) to 1.1946 (2016 low) at 1.5466. However, GBP/USD fails to sustain above 55 month EMA (now at 1.4259) so far. Break of 1.3038 support, will suggest that rise from 1.1946 has completed and will turn outlook bearish for retesting this low.
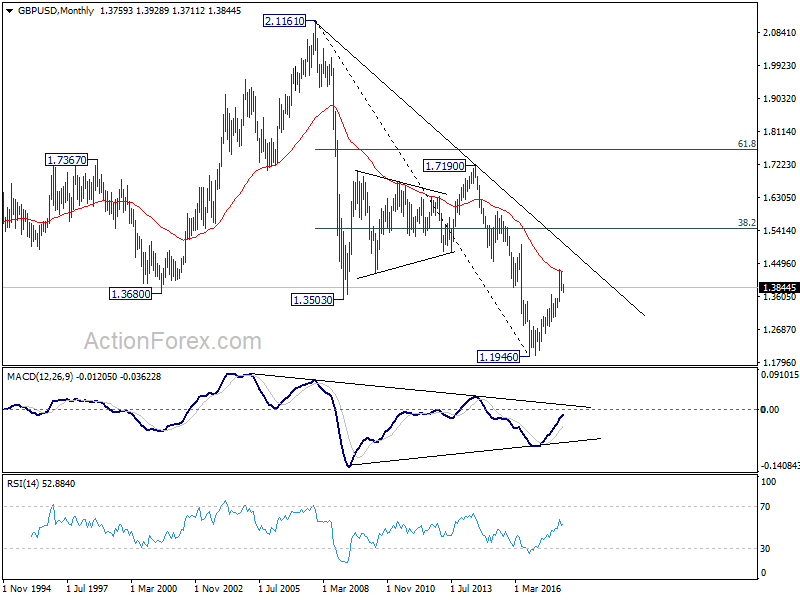
In the longer term picture, rise from 1.1946 should at least be correcting the whole long term down trend form 2.1161 and should target 38.2% retracement of 2.1161 (2007 high) to 1.1946 (2016 low) at 1.5466. It too early to tell if it's developing into a long term up trend. We'll monitor the upside momentum and reaction to 1.5466 to decide later.