
Sample Category Title
The “Winners” and the Losers of a Potential Trade War
Talks of a trade war have been dominating headlines in recent days, with investors being spooked that the latest US tariffs could spark retaliation from other major economies. The “good news” is that recent price action has given us a taste of what to expect in financial markets should the situation escalate from here.
Blink and you missed it. That is how quickly trade-related headlines have been hitting the wires recently, and how sharply markets have been responding to them. The trade narrative came into the spotlight last week, when the US administration announced its plans to slap tariffs on steel and aluminum imports. The announcement prompted major economies like the EU to indicate they will respond to protectionist measures in kind and introduce their own tariffs on the US, generating fears that the situation could rapidly escalate into a retaliatory trade war.
The market movements that ensued – as investors priced in the risk of such a war – are probably one’s best guide of what to expect in case tensions intensify. So, which assets stand to lose and gain the most in a potential tit-for-tat trade war? Let’s start with the losers, as they outnumber the “winners” and require more explaining.
Losers
Aussie & Loonie
In the G10 FX spectrum, the Australian and Canadian dollars probably stand to lose the most. Australia is an export-focused economy, so it could take a heavy hit in case global trade slows. Besides that, the Aussie is very sensitive to developments in China and as such, a slowdown in the Chinese economy due to tariffs would probably weigh on Australia too. Strangely enough, while the New Zealand dollar shares many similar qualities, it has not been responding too negatively to the tensions.
Canada is another major commodity exporter and since it exports the vast majority of its goods directly to the US, its economy would likely suffer in case of increased protectionism. While Canada will gain an exemption from the steel and aluminum duties, according to the White House, the duration of this exemption will depend on how NAFTA talks progress. This implies that the loonie will remain vulnerable to NAFTA negotiations, and also to the risk of tariffs by other countries.
EM currencies
The currencies of emerging economies would be rather defenseless as well. Most of these nations are very sensitive to investors’ risk appetite and global trade, and if trade volumes fall, their currencies could follow suit. Prominent examples include the Mexican peso and the South African rand. In the case of Mexico, the US said it will be excluded just like Canada, but that certainly does not mean the currency is now “out of the woods”.
US dollar – it’s complicated
The greenback weakened notably after the tariffs were announced. However, it lost ground mainly against major currencies, like the euro and the pound, while it managed to gain some ground against the likes of the South African rand. Thus, markets seem to be speculating that increased protectionism in the US would see its own economy perform worse than other developed economies like the Eurozone, but better than emerging economies that would be hit the hardest from trade restrictions. Thus, escalating trade tensions may exert upward pressure on pairs like euro/dollar and sterling/dollar.
Stocks, particularly in Asia – but France seems vulnerable too
Equities would likely be one of the worst performing assets in a trade war environment. There are exceptions of course, which will be outlined below. Speaking about stock markets in general though, they are likely to lose out as companies are faced with higher costs due to tariffs, and also find it more difficult to sell their products abroad. In the end, corporate profits would probably take a hit, exerting downward pressure on equity prices.
Based on the magnitude of the market reactions in recent days, one can argue that Asian stocks are likely to feel the heat even more than their US or European counterparts. This is reasonable, considering that many Asian nations are focused on manufacturing and exporting, and are thus more exposed to changes in global trading volumes.
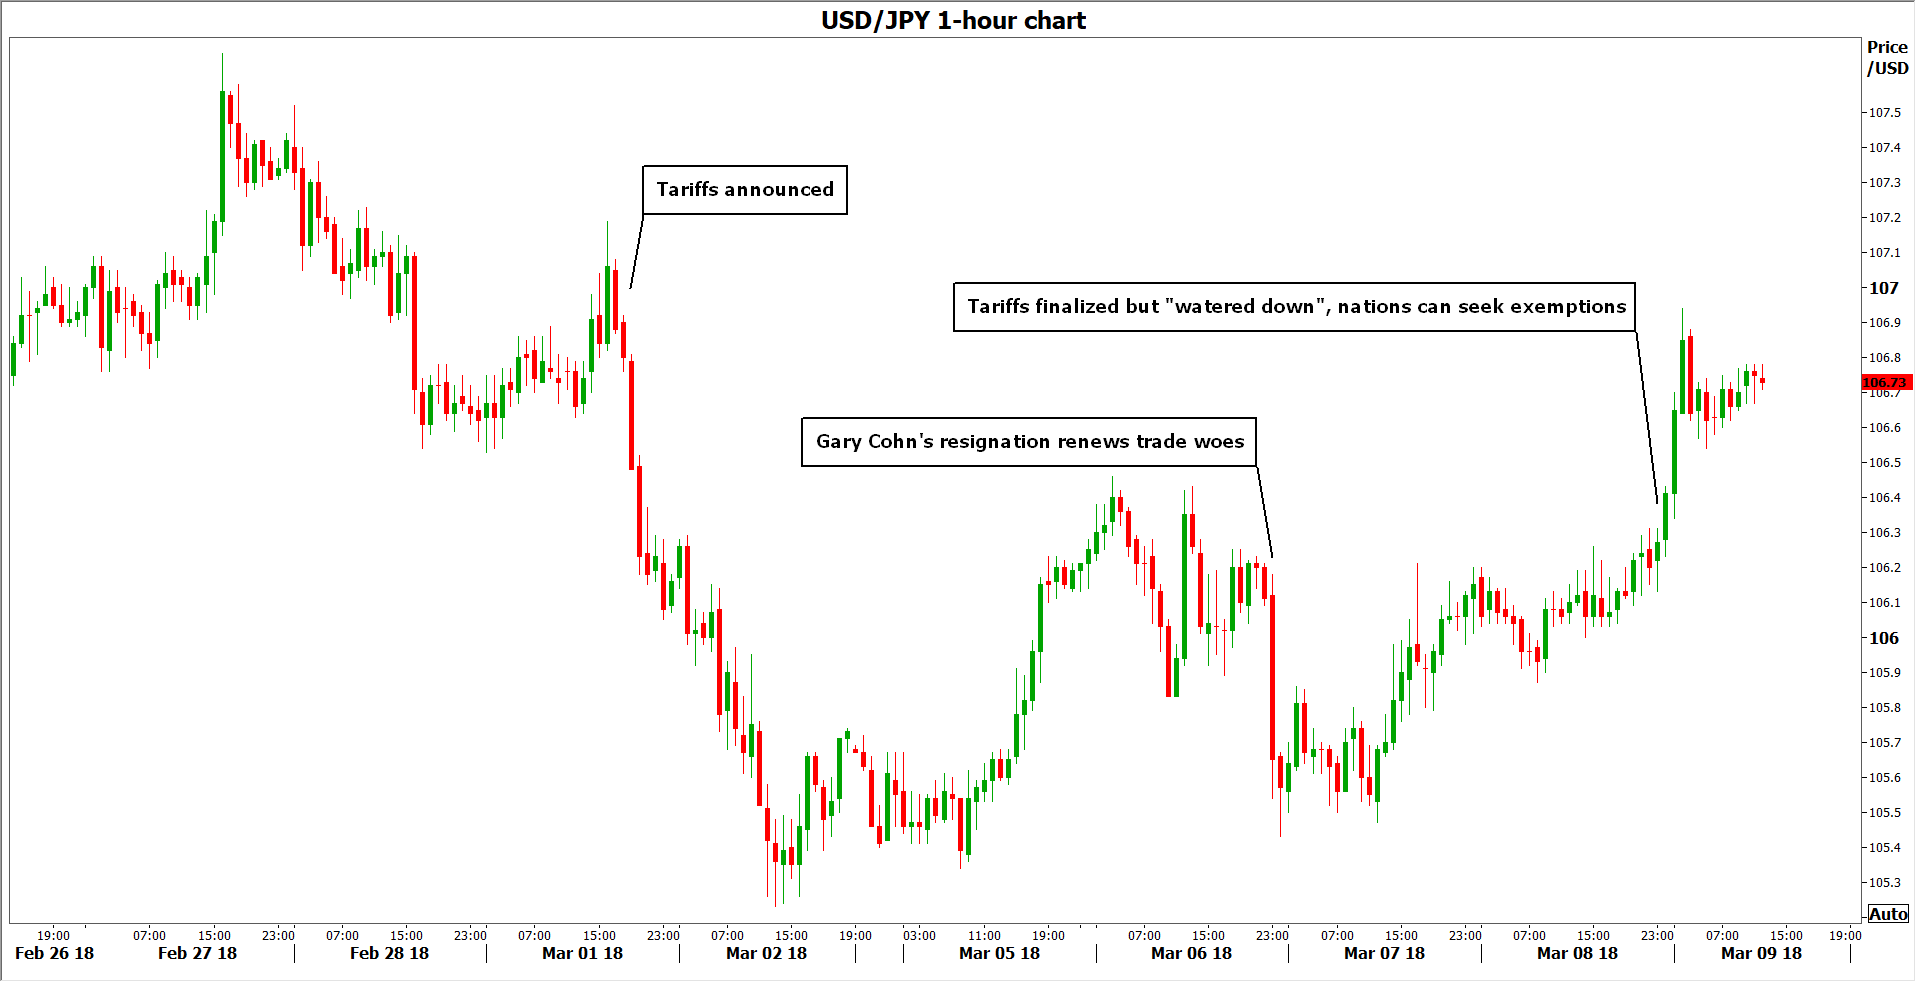
The biggest losses may be recorded in Japanese indices like the Nikkei 225 and the Topix. Since the US tariffs were announced, these indices have declined by much more than their counterparts, and the reason for this discrepancy may be related to the yen. The yen is considered as a safe haven and tends to gain in times of turmoil, such as right now. However, its appreciation typically weighs on Japanese stocks, as the stronger currency hurts the profits of major exporting firms, most of which are listed on the Nikkei.
The next most vulnerable benchmark seems to be the French CAC 40, which has been under severe pressure lately, perhaps due to the concentration of car and plane manufacturers in the index, many of which are major exporters. The Euro STOXX 50 also posted losses, but to be fair to European indices, some of their underperformance may be related to the political events in Italy, not just speculation on tariffs. Hong Kong’s Hang Seng index appears to be at risk as well. Funnily enough, these uncertainties seem to be affecting US and Chinese equity benchmarks the least so far. The S&P 500, Nasdaq 100, and CSI 300 are all higher overall in March.
Risk-sensitive commodities, like oil
Commodities like oil are considered relatively risky and are thus sensitive to changes in investors’ risk appetite. Given that risk sentiment and confidence would likely take a hit in the event of further protectionism, oil prices might come under pressure. From another perspective, tariffs would pose a danger to global economic growth and thereby, hinder demand for oil.
Winners
Japanese yen & Swiss franc – Euro to a smaller extent
The JPY and the CHF are seen as traditional safe haven currencies, that typically appreciate in times of turmoil as investors seek protection. This time was no exception, with both currencies gaining ground amid the trade uncertainties.
What was surprising, was seeing broad gains in the euro. While this may also reflect other factors, like speculation the ECB would appear hawkish at its March gathering, it is worth noting that the euro has served as a “safe haven” in the past. In case a trade war breaks out, the common currency could be viewed as a haven again, especially considering that European nations tend to do a higher portion of their trade between themselves and would thus be less impacted by a deterioration in global trade.
Precious metals, such as gold and silver
Precious metals have traditionally been viewed as safe assets, and true to that statement, both gold and silver saw a jump in their prices after trade headlines started to hit the wires last week.
Individual stocks of companies protected by tariffs
A good example of this is stocks of US steel companies. After Commerce Secretary Wilbur Ross first hinted at steel tariffs back in February 16, the stock price of the US Steel Corporation surged 17% in a single day. The logic is that faced with weakened competition due to the tariffs, these firms could well see their profits go up, and stock prices would follow. Another example is gains in US aluminum stocks after the aluminum tariffs announcement.
Government bonds
Bonds tend to attract safe haven demand, same as precious metals. The idea is that unless you are in a hyperinflationary environment or in a debt crisis, governments will typically pay your money back, and thus your investment is considered as “safe”.
Conclusion
There are generally no “winners” in a trade war, but some stand to lose more than others. While the probability of a full-blown trade war is still relatively low, it is not something to dismiss either as the past week has shown. It will be critical to see how major economies like the EU and China respond to the US tariffs. If they reply in harsh fashion, that could provoke more US action, starting a vicious protectionist cycle. If cooler heads prevail though and tensions deescalate, then the market moves that ensue will probably be the opposite of what was described above: safe havens could tumble, while riskier assets and trade-sensitive currencies may regain their footing.
Finally, the ideal proxies for trade tensions in the FX market may be pairs such as aussie/yen, loonie/yen, and Mexican peso/yen, as these will likely respond very sharply to increased protectionism.
Despite Speedbumps, Eurozone Expansion Continues
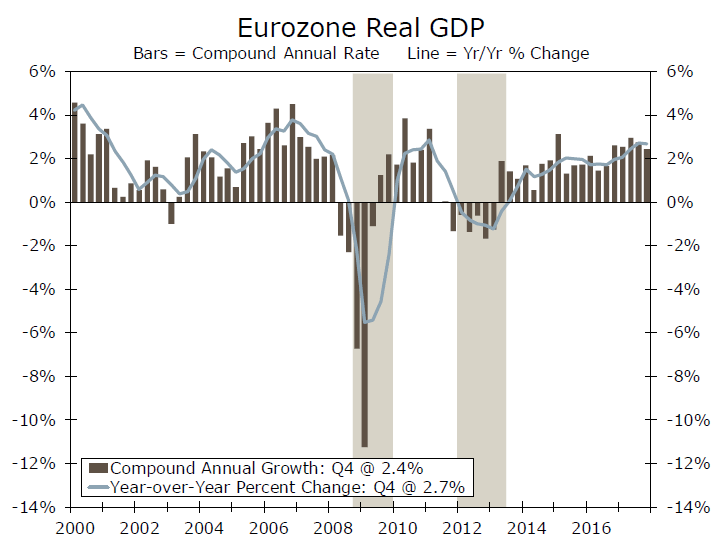
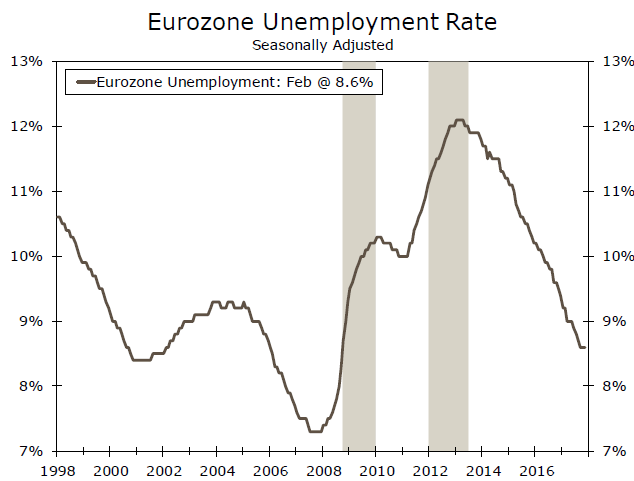
Real GDP in the Eurozone grew 2.5 percent in 2017, the strongest annual growth rate since 2007. There are some signs that the economic activity in the euro area has decelerated a bit thus far in 2018, but we look for the expansion to generally remain intact. The ECB also apparently has confidence in the economic outlook. At its policy meeting this week the Governing Council dropped a reference to expand its QE program again, if necessary. Although we look the Council to "taper" its QE program further later this year, benign inflation means that the ECB is probably in no hurry to actually tighten policy.
Data released this week confirmed that real GDP in the Eurozone grew at an annualized rate of 2.4 percent on a sequential basis in Q4-2017 (Figure 1). The new information in the data release - preliminary data printed at the end of January - was the breakdown of the GDP data into its underlying demand components.
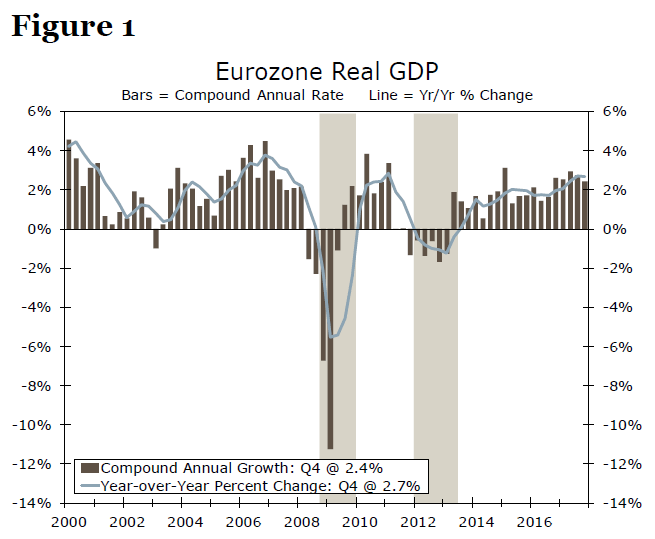
The good news is that all domestic spending components (i.e., consumer spending, investment spending and government spending) continued to expand in Q4. The bad news is that sequential growth in domestic demand was sluggish, rising only 1.5 percent on an annualized basis. Strength in exports relative to imports - the former rose nearly 8 percent while the latter grew only 4.4 percent - boosted the overall rate of real GDP growth in the fourth quarter.
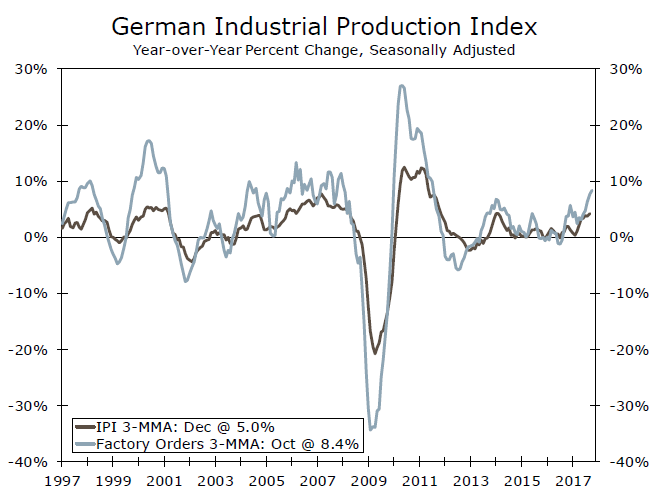
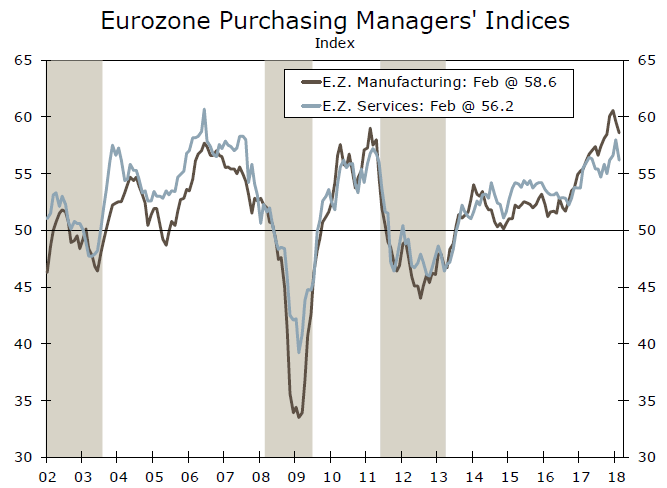
The data from January that are now starting to trickle in suggest that economic activity may be decelerating a bit in early 2018. For example, retail sales in the overall euro area edged down 0.1 percent in January, which follows the 1.0 percent decline that was registered in December. Factory orders in Germany tumbled 3.9 percent in January, completely reversing December's 3.0 percent gain. Industrial production (IP) in Germany declined 0.1 percent in January, while IP in France fell 2.0 percent. That said, the year-over-year growth rates in factory orders and IP in Germany remained robust in January (Figure 2).
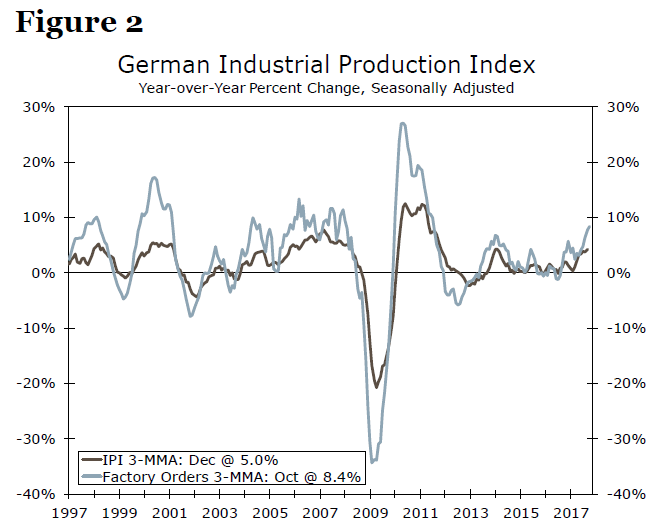
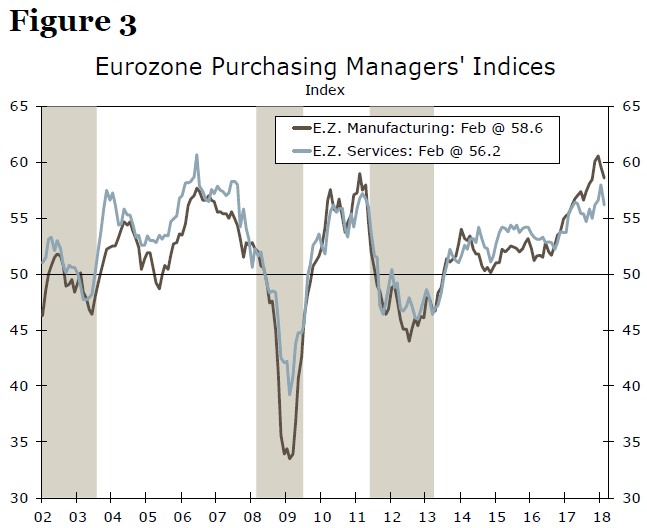
Does this mean that the expansion in the euro area is stalling? Probably not. For starters, sequential growth rates can be volatile. As the year-over-year strength in German factory orders and IP show, underlying growth momentum appears to be solid at present. In addition, the manufacturing and service sector PMIs remained at high levels through February, although both indices have edged a bit lower in recent months (Figure 3). Moreover, macroeconomic policy in the Eurozone is still accommodative at least for now, and bank credit is accelerating. We look for some deceleration in Eurozone real GDP this year, but we expect that the expansion will generally remain intact.
The European Central Bank (ECB) is showing increased confidence in the economic outlook. Until this week, the Governing Council had been saying that it could increase the size or duration of its quantitative easing (QE) program, if necessary. At its policy meeting on March 8 the Council dropped this reference to increasing its QE program. In our view, the ECB is signaling that it intends to "taper" its QE program further later this year.
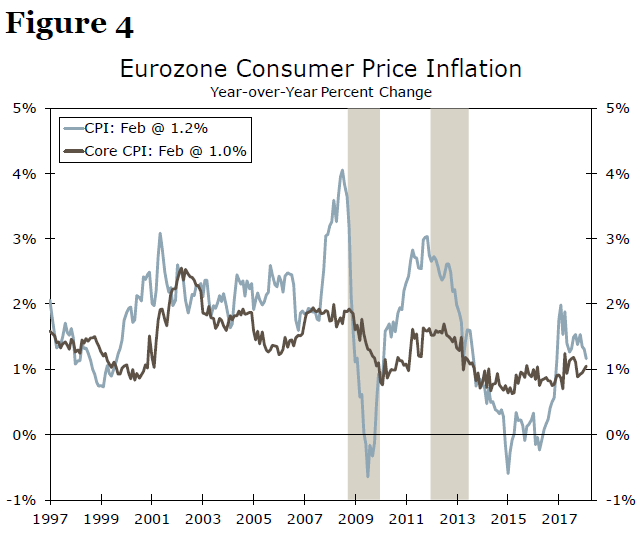
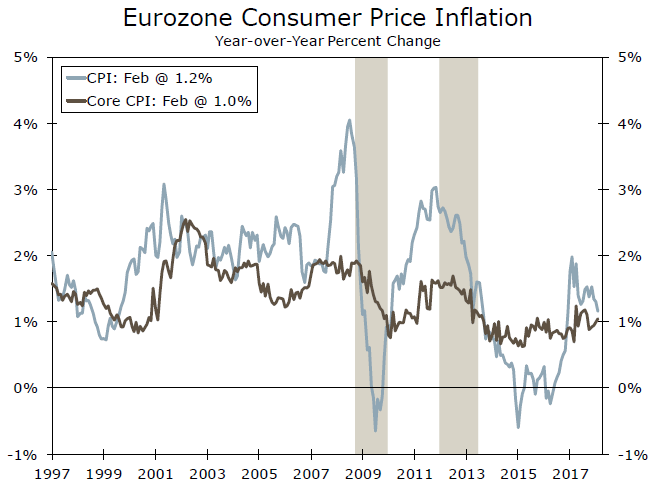
That said, the Governing Council appears to be in no hurry to tighten policy. ("Tapering" just dials back further accommodation.) The policy statement this week noted that "measures of underlying inflation remain subdued and have yet to show convincing signs of a sustained upward trend" (Figure 4). Indeed, we continue to believe that the Council will refrain from hiking rates until well into 2019.
Weekly Economic and Financial Commentary: February Hiring Heats Up, While Wages Cool Down
U.S. Review
February Hiring Heats Up, While Wages Cool Down
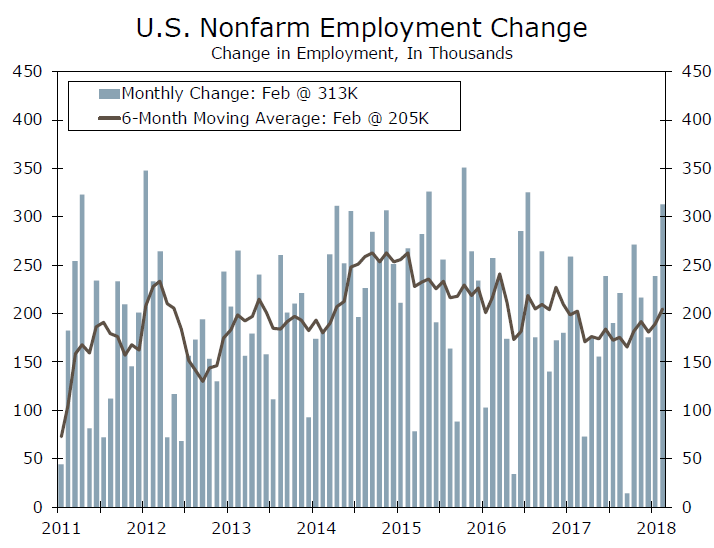
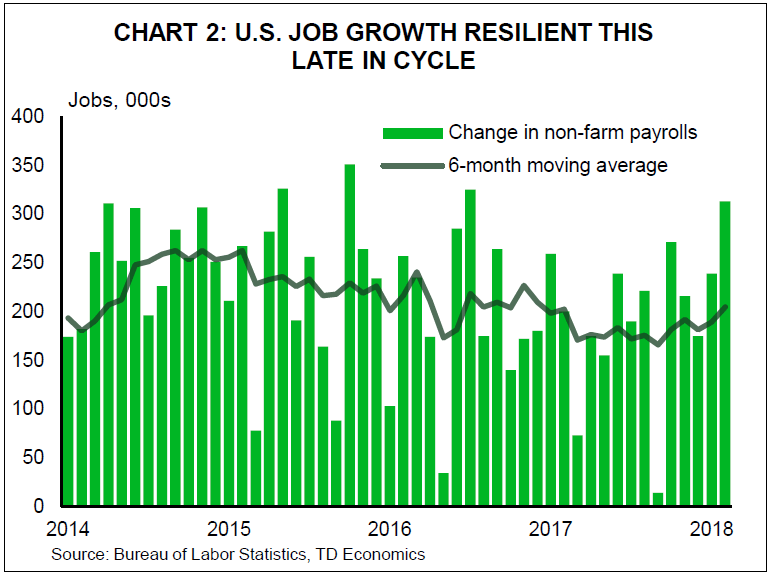
- Businesses added 313,000 new jobs in February and the unemployment rate was unchanged at 4.1 percent. Average hourly earnings growth slowed to 0.1 percent, but the trend remains upward.
- The ISM non-manufacturing index edged down in February, but remained well within expansion territory at 59.5.
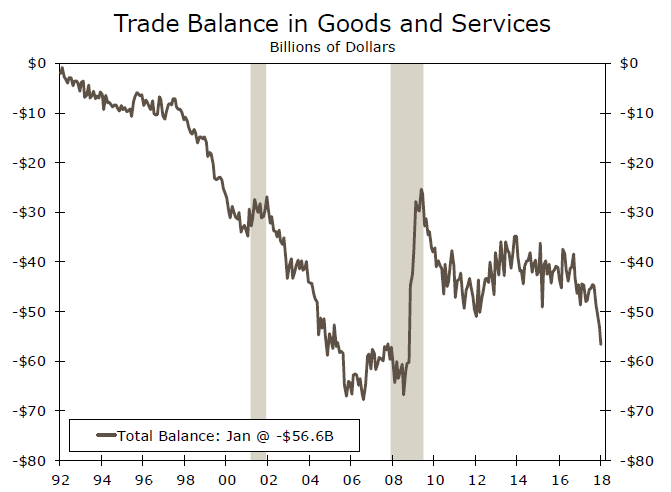
- In January, the trade deficit widened by $2.7 billion to reach the largest gap since October 2008. Lower exports of goods and services drove the increase, as imports were more or less flat over the month.
February Hiring Heats Up, While Wages Cool Down
Employment growth strengthened in February with businesses adding 313,000 new jobs. That pushed the three-month average up to 242,000 after job gains in December and January were also revised higher by a net of 54,000 jobs. Strength was widespread across industries, including gains of 50,000 in retail, 28,000 in financial services and 61,000 in construction, which likely benefited from a return to less severe winter weather.
Nevertheless, the unemployment rate was unchanged at 4.1 percent amid the largest monthly increase in the labor force since 2003. The labor force participation rate rose 0.3 points to 63.0, which puts it back at the top end of the past two year's range.
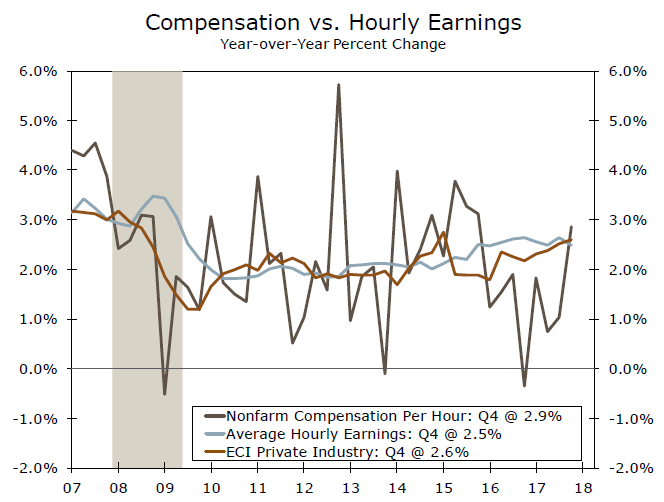
Average hourly earnings were up 0.1 percent (0.149 percent before rounding), barely missing expectations for a 0.2 percent increase. February average hourly earnings were up 2.6 percent from a year ago compared to 2.5 percent in 2017.
Other data released this week point to labor compensation trending higher. The updated look at fourth quarter productivity and costs showed hourly compensation increasing at a 2.4 percent annualized pace in the fourth quarter compared to an earlier estimate of 1.8 percent. That puts compensation per hour up 2.9 percent over the past year and makes it look more consistent with the increase in average hourly earnings over the same period.
Moving beyond the labor market, the ISM non-manufacturing index suggests that the economy continues to expand at a solid clip. The index edged down 0.4 points to a still-strong 59.5 after setting a cycle high in January. Current activity edged up and a 12-year high in new orders suggest near-term momentum remains positive.
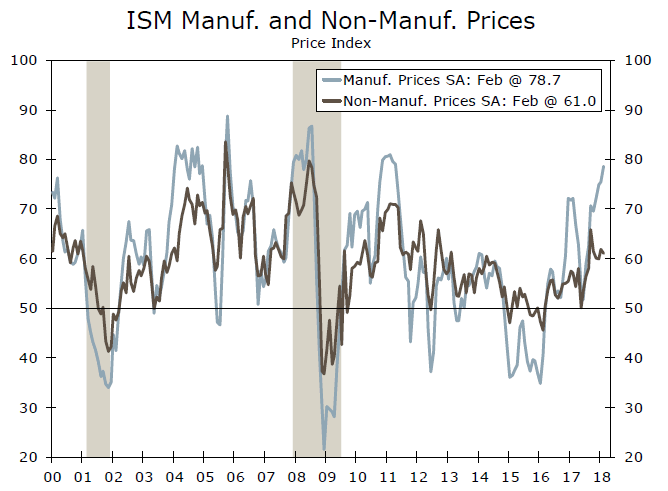
Higher input costs may be becoming more of a concern for businesses, however. The prices paid component of the ISM nonmanufacturing survey ticked down almost a point but, at 61, still indicates input costs rising at nearly the fastest pace in a number of years. Cost concerns were more ubiquitous in the comments section. Respondents ranging from construction and mining to health care and hospitality specifically mentioned higher prices. Although more impactful for the manufacturing sector, where input prices are rising more dramatically, recent tariff plans could intensify cost pressures. We discuss tariffs' impact on price inflation further on page 7 in our Topic of the Week.
The proposed tariffs have been fueled in part by the Trump administration's concerns over the trade deficit. The most recent monthly trade print is unlikely to allay their concerns. In January, the trade deficit widened by $2.7 billion to reach the largest gap since October 2008. Lower exports of goods and services drove the increase as imports were more or less flat over the month. The drop in exports was driven by some of the more volatile categories like aircraft and petroleum products. We expect exports to recover in the coming months due to solid growth in the rest of the world and a weaker dollar. However, imports should also rise amid strong domestic demand, keeping trade as a drag on real GDP growth over the next few quarters.
U.S. Outlook
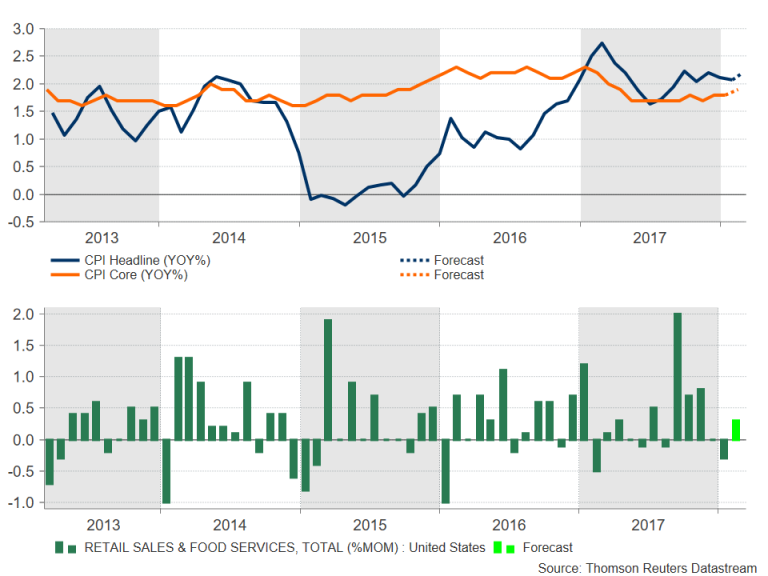
CPI • Tuesday
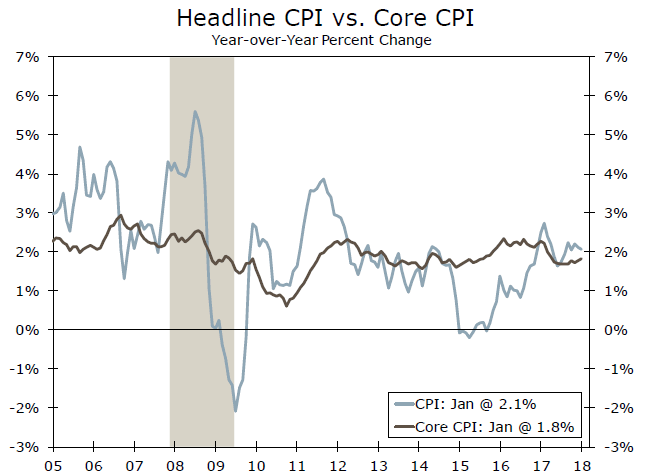
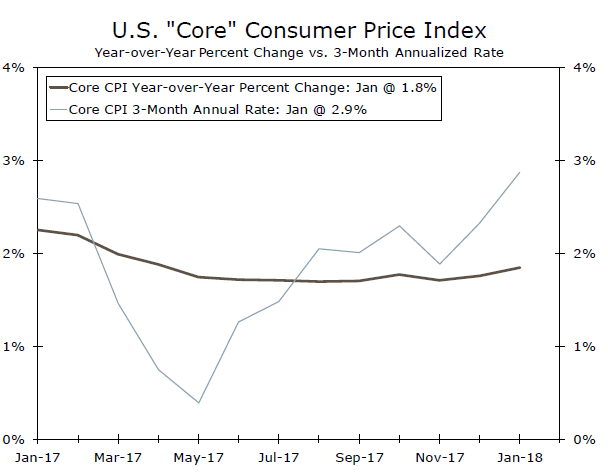
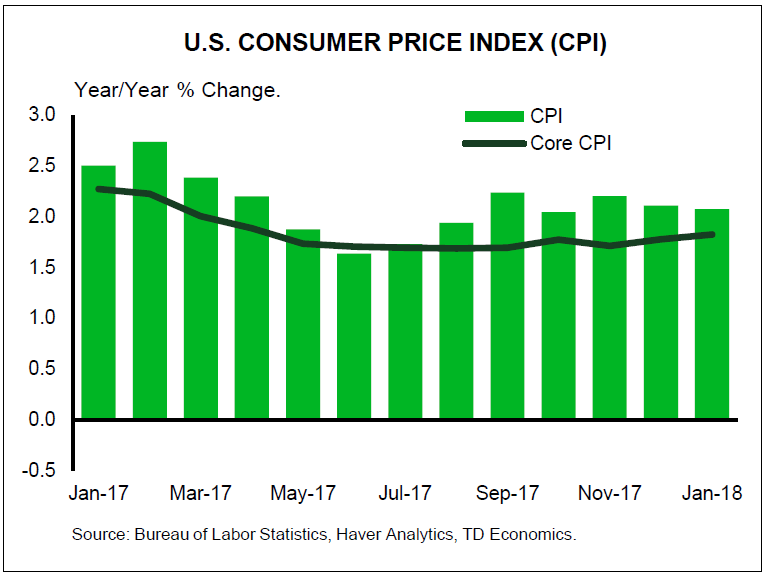
The recent pickup in inflation pressure was underscored by a largerthan- expected 0.5 percent gain in the CPI during January. Headline prices have increased 2.1 percent over the year, as higher energy prices provided a lift both on the month and on the year.
Core inflation gains were notable in January, notching a 0.3 percent rise during the month on higher prices for goods, particularly used vehicles and apparel, and services prices which were boosted by medical and insurance costs. Core CPI year-over-year growth held steady at 1.8 percent in January, but its 2.9 percent three-month annualized rate suggests the trend is strengthening more recently.
The Fed will be encouraged that the inflation readings have firmed as expected, and is likely to proceed with plans to tighten monetary policy.
Previous: 0.5% Wells Fargo: 0.1% Consensus: 0.2% (Month-over-Month)
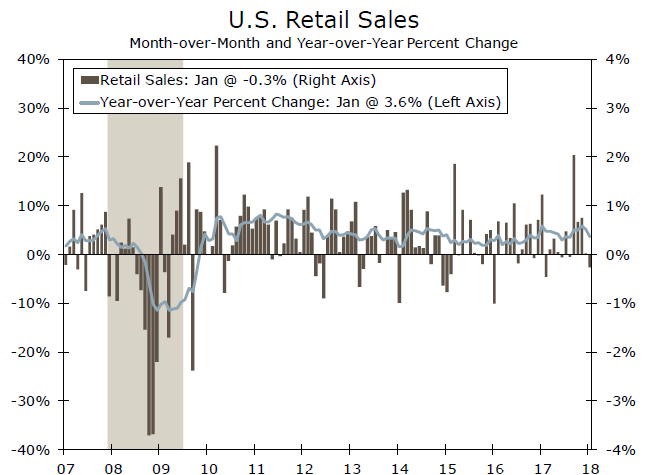
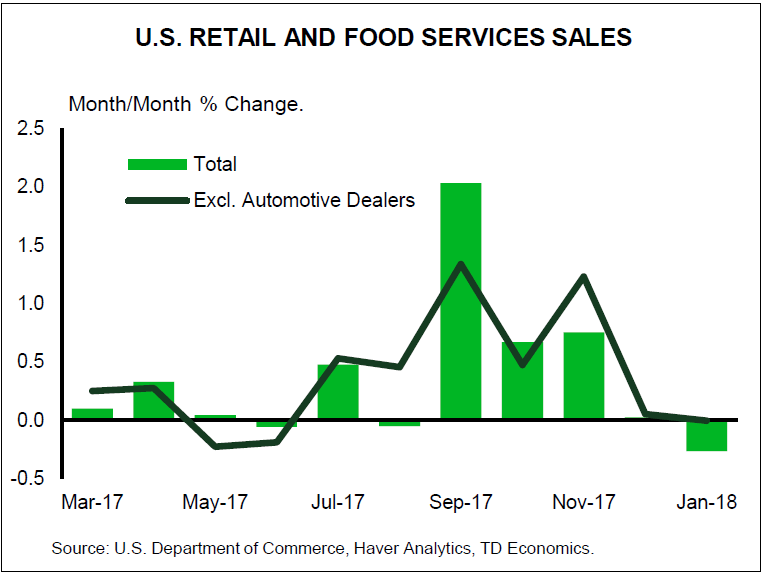
Retail Sales • Wednesday
January's 0.3 percent decline in headline retail sales was a surprise, and downward revisions to past months' control group sales made it more disappointing. Even with higher gasoline prices, sales ex-auto were down 0.2 percent in January. Motor vehicles sales posted the largest decline in January, but there were also broad based monthto- month losses in other categories. We expect seasonal adjustment issues were more to blame than an actual slowing in consumer purchases from December to January. Compared to January 2017, nominal retail sales were up solidly, with nonstore retailers and gasoline stations posting the largest sales growth over the year.
February's showing should be stronger, and it will be interesting to see what impact, if any, the new tax withholding schedules that took effect in February had for retailers. We will also be watching for the impact that rising inflation may have on spending in coming months.
Previous: -0.3% Wells Fargo: 0.3% Consensus: 0.3% (Month-over-Month)
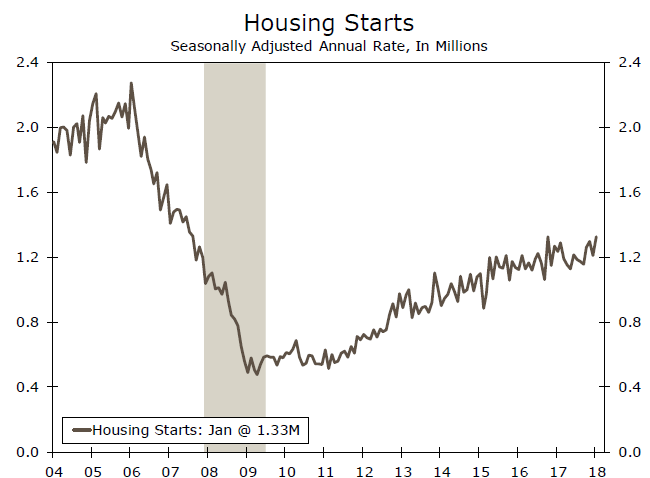
Housing Starts • Friday
Homebuilding got off to a solid start this year, as housing starts rose 9.7 percent to a 1.33-million unit pace in January. These data can be volatile in winter months, but the January ramp-up is still a reassuring sign that the stage is set for a strong spring season for the housing market.
Multifamily starts were particularly strong, rising 23.7 percent in January. Single-family starts rose 3.7 percent. The Northeast saw the largest percentage gain even with severe weather early in the month, though weather likely held back building in the Midwest. The South and West are seeing solid rises in both multifamily and single-family building, thanks to continued population and job gains. Overall momentum should continue strengthening as the year progresses, though labor shortages and higher materials costs could exert some downward pressure, particularly in the West where building is already expensive.
Previous: 1,326K Wells Fargo: 1,283K Consensus: 1,291K
Global Review
Despite Speedbumps, Eurozone Expansion Continues
- Real GDP in the Eurozone grew 2.5 percent in 2017, the strongest annual growth rate since 2007. There are some signs that economic activity in the euro area has decelerated a bit thus far in 2018, but we look for the expansion to generally remain intact.
- The ECB apparently has confidence in the economic outlook. At its policy meeting this week, the Governing Council dropped a reference to expand its QE program again, if necessary. Although we look for the Council to "taper" its QE program further later this year, benign inflation means that the ECB is probably in no hurry to actually tighten policy.
Despite Speedbumps, Eurozone Expansion Continues
Data released this week confirmed that real GDP in the Eurozone grew at an annualized rate of 2.4 percent on a sequential basis in Q4-2017 (see graph on front page). The new information in the data release—preliminary data printed at the end of January—was the breakdown of the GDP data into its underlying demand components.
The good news is that all domestic spending components (i.e., consumer spending, investment spending and government spending) continued to expand in Q4. The bad news is that sequential growth in domestic demand was sluggish, rising only 1.5 percent on an annualized basis. Strength in exports relative to imports—the former rose nearly 8 percent while the latter grew only 4.4 percent—boosted the overall rate of real GDP growth in the fourth quarter.
The data from January that are now starting to trickle in suggest that economic activity may be decelerating a bit in early 2018. For example, retail sales in the overall euro area edged down 0.1 percent in January, which follows the 1.0 percent decline that was registered in December. Factory orders in Germany tumbled 3.9 percent in January, completely reversing December's 3.0 percent gain. Industrial production (IP) in Germany declined 0.1 percent in January, while IP in France fell 2.0 percent. That said, the year-over-year growth rates in factory orders and IP in Germany remained robust in January (top chart).
Does this mean that the expansion in the euro area is stalling? Probably not. For starters, sequential growth rates can be volatile. As the year-over-year strength in German factory orders and IP show, underlying growth momentum appears to be solid at present. In addition, the manufacturing and service sector PMIs remained at high levels through February, although both indices have edged a bit lower in recent months (middle chart). Moreover, macroeconomic policy in the Eurozone is still accommodative at least for now, and bank credit is accelerating.
Real GDP in the Eurozone grew 2.5 percent in 2017, which was the strongest annual growth rate since 2007. We look for some deceleration this year, but we expect that the expansion in the Eurozone will generally remain intact.
The European Central Bank (ECB) is showing increased confidence in the economic outlook. Until this week, the Governing Council had been saying that it could increase the size or duration of its quantitative easing (QE) program, if necessary. At its policy meeting on March 8 the Council dropped this reference to increasing its QE program. In our view, the ECB is signaling that it intends to "taper" its QE program further later this year.
That said, the Governing Council appears to be in no hurry to tighten policy. ("Tapering" just dials back further accommodation.) The policy statement this week noted that "measures of underlying inflation remain subdued and have yet to show convincing signs of a sustained upward trend" (bottom chart). Indeed, we continue to believe that the Council will refrain from hiking rates until well into 2019.
Global Outlook
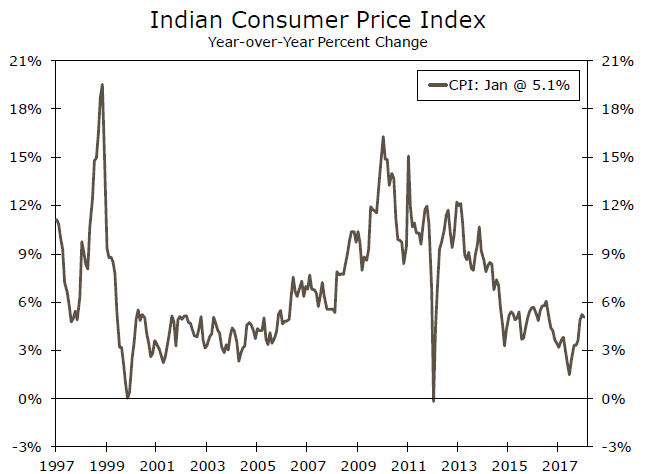
India Consumer Price Index • Monday
A perfect storm of demonetization, rupee appreciation, falling food prices and slowing economic growth pushed Indian inflation below 2 percent by mid-2017. Sluggish growth and inflation led the Reserve Bank of India (RBI) to cut its repo rate 200 bps since 2015. However, inflation has since moved closer to the RBI's 4 percent target (with a +/- target band of 2 percentage points). Food prices account for nearly half the weight of the Indian CPI, and a turnaround in food price growth has propelled the index higher. The food and beverage component of the Indian CPI was up 4.6 percent in January, a marked pickup from 1.2 percent deflation as recently as last June.
The inflation pressures have extended beyond food, as both fuel and shelter prices have accelerated since last summer. The RBI is likely to proceed with caution as disruptions from structural reforms echo through the economy, but a sustained acceleration in prices in the coming months could force the RBI's hand.
Previous: 5.07% Consensus: 4.74% (Year-over-Year)
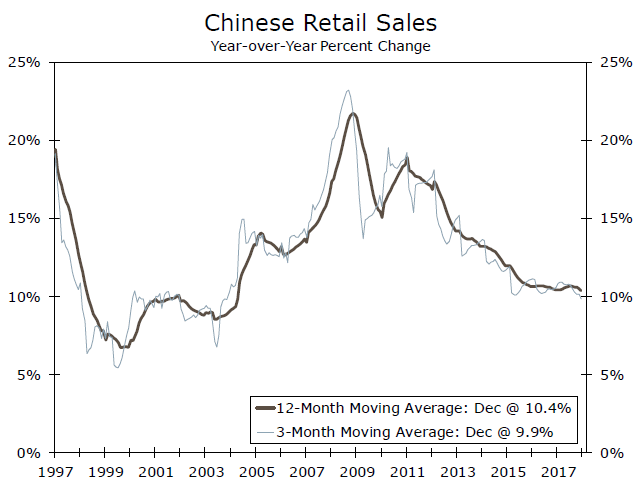
China Retail Sales • Tuesday
As China's economy has developed, policymakers have strived to rebalance economic growth away from its heavy reliance on investment spending and towards a more consumption-oriented model. To that end, retail sales growth held up fairly well in China last year. Retail sales grew 10.2 percent in 2017 compared to 10.4 percent in 2016. A challenge to sustaining this growth in future years will be unfavorable demographics—the working-age population has already peaked and is expected to decline by nearly 2 percent between 2015 and 2025. Chinese industrial production data also print next Wednesday, with markets eyeing whether Chinese manufacturers can sustain the momentum achieved in 2017.
Because of the Chinese New Year, next week's retail sales/industrial production data will encompass both January and February, adding a bit more weight than usual to these typically monthly prints.
Previous: 10.2% (Year-to-Date) Consensus: 10.0% (Year-to-Date)
Eurozone Employment• Wednesday
Data on employment in the Eurozone in Q4-2017 will be released next Wednesday. Employment growth was a solid 1.7 percent year over year in Q3, helping to bring the unemployment rate down to post-Great Recession lows. Spain, Portugal, Italy and Sweden outpaced the Eurozone's quarterly average employment growth, while Greece and France were among the laggards. However, the quarterly weakness in Greece came on the heels of two strong quarters: the year-over-year employment growth was 2.0 percent in Q3.
Continued strength in employment growth across Europe would help European Central Bank policymakers reaffirm that it should end its bond-buying program by the end of this year. Our forecast looks for real GDP growth in the Eurozone to exceed long-term potential growth in the next two years, which should help drive the unemployment rate in the euro area even lower.
Previous: 0.4% (Quarter-over-Quarter)
Point of View
Interest Rate Watch
Things fall apart
Over the past six months, the framework for an economic outlook based upon the prior five year history of economic performance has fallen apart. As illustrated in the top graph, over the past three months, core CPI has risen 2.9 percent, intimating that the year-over-year core CPI and overall CPI will rise. In addition, we anticipate the PCE deflator will rise steadily to approach, then exceed the FOMC's 2 percent target (precisely 2.2 percent) in the second quarter of 2018 and remain at about that pace in Q3.
In addition, despite the rise in the funds rate and short-term interest rates in the U.S., the trade-weighted dollar has continued to decline contrary to many analyst expectations.
Finally, recent Treasury auctions have been disappointing while projected Treasury financing over the next few years has shifted upward.
Center Cannot Hold
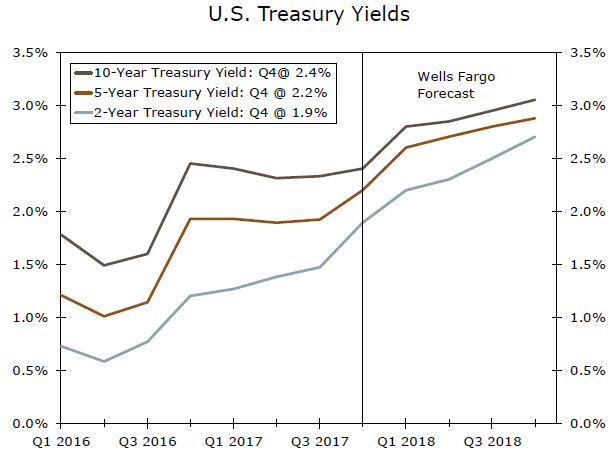
As a result, market interest rates and expectations of future interest rates (middle graph) have moved upward away from the pattern of the past five years and interest rates have broken from the range of the past five years.
Fundamentals are, well, fundamental. The four forces of higher growth expectations, higher inflation expectations, weaker dollar and increased future federal deficit estimates all support the case that interest rates will rise in the period ahead and will not return to the center of economic expectations of the past.
Ride the Lightening
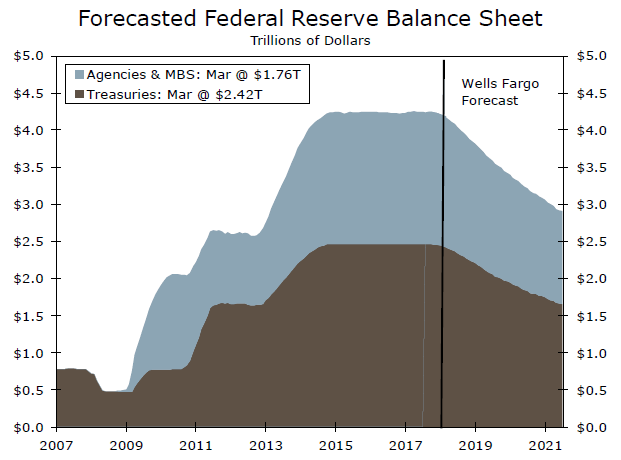
What to do? Our outlook remains for higher market interest rates ahead. We are particularly concerned about the conflict of the FOMC's intent to reduce their balance sheet (bottom graph) in the face of rising CBO estimates of federal financing needs. Once again, the center cannot hold at the current interest rate/dollar/growth combination.
We are not assured that plans of a simultaneous reduction of the balance sheet and increases in the funds rate are consistent with growth at a 2.5 percent plus pace.
Credit Market Insights
Beige Book Corroborates Hard Data
Amid several credit market reports released by the Federal Reserve this week, the March Beige Book detailed generally positive credit conditions across the 12 Federal Reserve districts. The majority of districts reported unchanged or modestly stronger loan demand to start the year, and noted an optimistic outlook for lending activity and credit quality in the next six months. Some districts also described a modest decline in delinquency rates across various loan types.
The soft data from the most recent Beige Book largely confirms the hard data seen in this week's consumer credit report. Consumer credit expanded a solid $13.9 billion in January, even with relatively flat revolving credit growth, which is largely comprised of credit card loans. Beige Book respondents noted that consumers likely paid down credit card bills following the holiday shopping season. Nonrevolving credit subsequently drove the expansion, up about 5 percent in January, year over year.
While overall consumer credit remains solid, increasing short-term interest rates on various loan types detailed by Beige Book respondents is a key area to watch over the coming months. Indeed, credit card interest rates have increased over the course of 2017, now at 13.2 percent in Q4. We forecast three hikes in the federal funds rate this year, likely pushing interest rates on consumer loans higher. However, in the near-term, solid loan quality and lower delinquency rates will likely support continued health in the credit market.
Topic of the Week
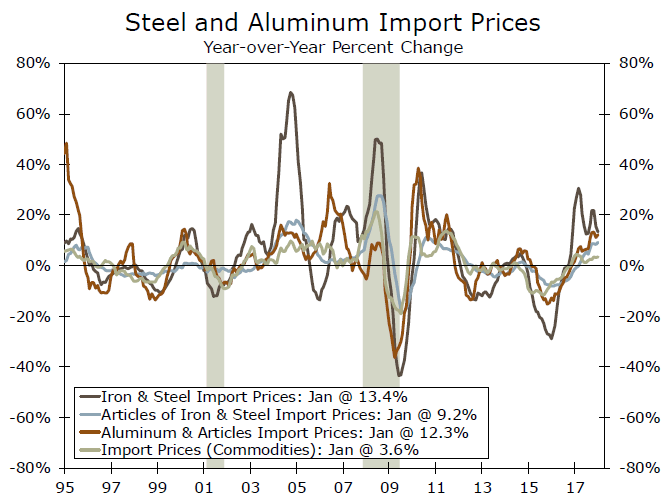
Limited Pass-Through of Tariffs to CPI
On March 8, President Trump imposed tariffs of 25 percent on steel imports and 10 percent on aluminum imports, with Canada and Mexico excluded for now and the possibility to extend exemptions to other countries. Prices for some products may rise as a result, but we suspect that the effect on overall consumer price index (CPI) inflation will be modest at best.
The combined share of steel and aluminum imports hovers below 4 percent of total U.S. merchandise imports, which limits the effect on overall prices (top chart). If steel and aluminum import prices increased by the full amount of the recently-proposed tariffs, this could add about 79 basis points to year-over-year import price inflation. Domestic producers could also raise prices as tariffs ease competitive pressure.
The ultimate pass-through to consumer price inflation, however, tends to be small after steel and aluminum get incorporated into finished products. Although there are positive correlations between producer prices for steel and aluminum and the CPI, the relationship is weaker than it is between import and producer prices. This is not surprising given that nearly two-thirds of CPI consists of services, where the largest input cost is labor.
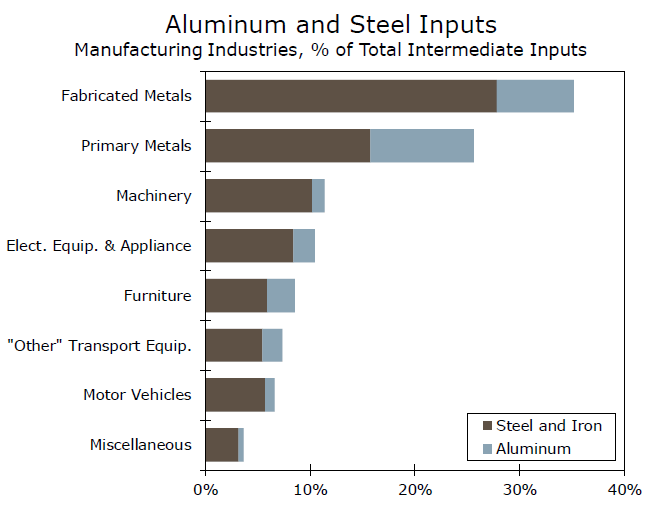
That is not to say some industries will not see significantly higher costs. A look at the detailed input-output tables for the United States reveals which industries bear the greatest exposure to higher steel and aluminum costs (bottom chart). Still, the pass-through to consumers should be fairly small. Even in the industries that use steel and aluminum most intensively, those metals account for less than 40 percent of costs. In addition, firms may absorb some of the costs via tighter margins rather than adjusting prices fully.
We suspect that CPI inflation would rise only modestly as a result of the currently-proposed tariffs, assuming no trade war ensues. This would likely not be enough to change the Fed's path of rate hikes. For more, see "Steel Your Nerves: Effects of Tariffs on U.S. Inflation."
The Weekly Bottom Line: All Signs Point to Higher Inflation
U.S. Highlights
- President Trump announced tariffs on steel and aluminium imports to take effect in 15 days. The scope is narrower than initially announced. Mexico and Canada are exempt, and more allies may be excluded once the levies take effect.
- The American economy continues to hum along, with a very solid job report in February. The Fed's Beige Book also painted a relatively rosy picture, but also one where businesses are starting to pass higher costs onto customers.
- Inflationary pressures are building in the U.S., and import tariffs will increase the force. This presents a challenge for the Fed which will have to incorporate the uncertain impacts of fiscal stimulus, and now tariffs into its forecast.
Canadian Highlights
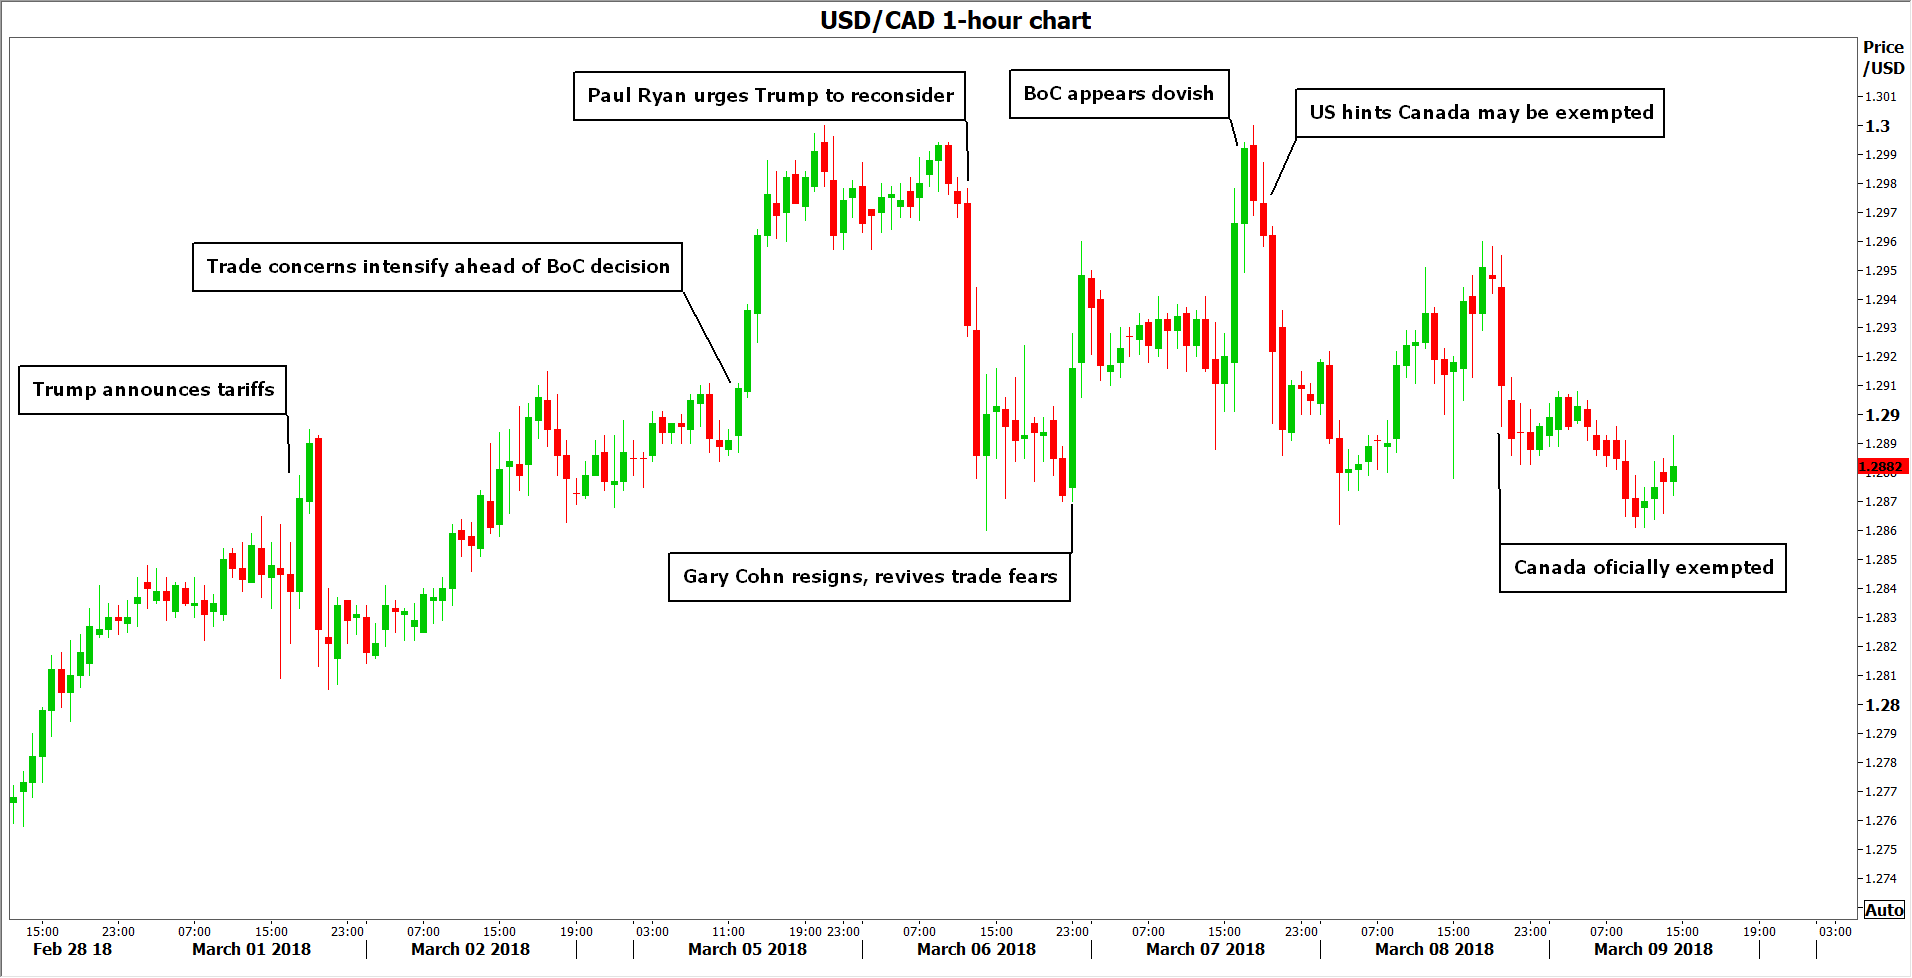
- Canada avoided (at least temporarily) the U.S. administration's steel and aluminum tariffs, providing a relief and potentially even a modest boost to the industries.
- The Bank of Canada left the overnight rate unchanged at 1.25% this week, but struck a dovish tone, citing trade uncertainty and the impact of recent housing regulations.
- Canada added 15.4k jobs in February, bringing the unemployment rate to 5.8%. Wage growth ticked down slightly, but remained buoyant at 3.1% year-on-year (from 3.3% in January).
U.S. - All Signs Point to Higher Inflation
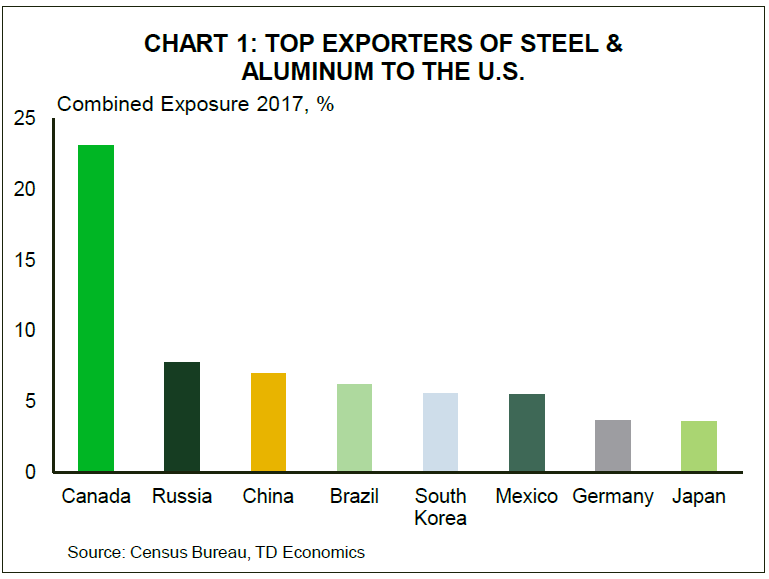
Politics overshadowed economics this week as markets awaited Trump's announcement on steel and aluminum tariffs. When it came on Thursday afternoon the scope was narrower than first thought. Canada and Mexico are exempt from the tariffs as long as negotiations on the North American Free Trade Agreement continue, and other allies may ultimately be exempt once the tariffs are put in place in 15 days. Together Canada and Mexico represent a quarter of American steel imports and 43 percent of aluminum. America's neighbors may now benefit from the plan as they take market share from other countries slapped with tariffs.
However, trading partners are expected to retaliate, levying tariffs on U.S. exports. Economic studies have shown that the overall costs to the economy from these trade battles outweigh the job gains in the protected sector. Our own estimates for the steel and aluminum tariffs specifically suggest the overall growth impacts in the large U.S. economy would be fairly modest, but that they could raise inflation a couple of tenths of a percentage point.
The President didn't stop at steel and aluminum. He reiterated his goal to reverse the U.S. trade deficit, and that he may implement a reciprocal or "mirror tax" to help achieve this. He offered few details, but suggested the U.S. would slap the same level of duties on trading partners that U.S. companies face in those countries. These actions will raise prices for many U.S. businesses that use the materials as inputs in manufacturing, and ultimately raise prices for consumers, adding to budding inflation pressures across the economy.
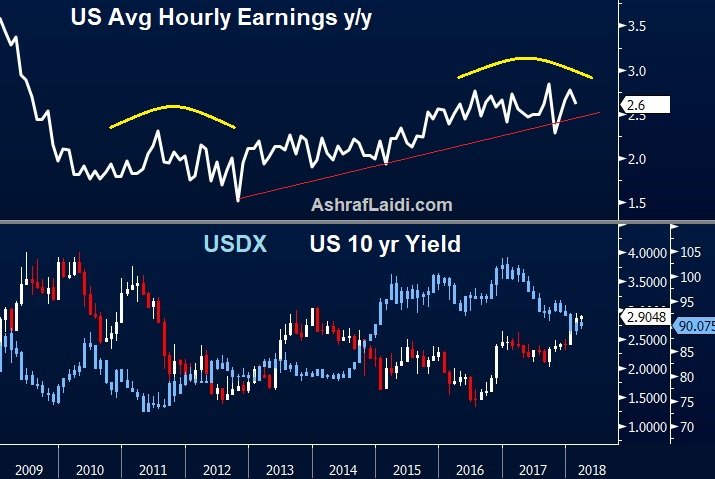
This week's economic data certainly doesn't suggest the U.S. needs economic protection. Payrolls grew by an impressive 313k jobs in February. The unemployment rate stayed at its 17-year low of 4.1%, where it has been since October. Hiring has accelerated in recent months, driven by the goods sector, which had stumbled somewhat in the wake of the oil price crash, but is now making up the lost ground. Wage growth cooled slightly, with average hourly earnings up 2.6% versus a year ago, down from 2.8% in January. However, when this volatile series is smoothed, wage gains have been steady at around 2.6% for about a year, and have been outpacing inflation for over three years.
The Fed's Beige Book also painted a picture of an economy that is humming along. Fed districts universally reported labor market tightness and heightened demand for qualified workers. Several districts reported increasing compensation as a result of the tax cuts that came into effect at the start of the year. The report also suggested that businesses are increasingly passing on increases in input prices. A variety of forces are expected to push inflation higher this year, the only question is how quickly.
The risks that inflation will accelerate faster than the Fed currently expects are mounting. The FOMC's next announcement is on March 21st, and a hike at the meeting is essentially a lock. We currently expect three 25-basis point moves in 2018, but the risks are skewed to more hikes rather than fewer.
Canada - Canada Avoids Trump's Tariffs (For Now)
The Bank of Canada surprised no one with its decision to leave interest rates unchanged this week. The policy announcement is usually the main event for economy watchers in Canada, but took second billing to an announcement south of the border on steel and aluminum tariffs. When that decision came down, it was good news for Canada, as it will be exempt from the 25% tariffs on steel and 10% tariffs on aluminum, pending a successful renegotiation of NAFTA.
Had the tariffs been imposed they would have resulted in a decline in steel and aluminum production and exerted a modest headwind on the Canadian economy – likely enough to shave a tenth of a percentage point off real GDP growth. The impact would have been concentrated in Ontario and Quebec, where most of the steel and aluminum is produced and downstream users of both products are located. However, with the exemption the two regions may benefit from decreased competition from parts of the world hit by tariffs. Still, with NAFTA negotiations showing little evidence of a speedy resolution, uncertainty will continue to hang over Canada's manufacturing sector.
Turning back to Ottawa, the Bank of Canada's statement was explicit in its recognition of risks on the external front, noting that net exports were a significant drag on economic growth in the fourth quarter of last year and that "trade policy developments are an important and growing source of uncertainty for the global and Canadian outlooks." Indeed, the statement overall struck a dovish tone, also referencing the impact of new housing regulations and the economy's sensitivity to rising rates.
As part of a new communication strategy, Deputy Governor Tim Lane provided more colour on the Bank's thinking. Lane struck a more positive tone, remarking on domestic strengths and encouraging trends. Still, the overall tone of communication suggests the Bank is in wait and see mode – looking for clarity on the trade front and on how the Canadian economy and heavily indebted households in particular are responding to the three rate hikes it has already enacted over the past year.
Beyond policy, the economic data out this week showed an economy that continues to make steady, if more staid, economic progress. The Canadian economy added 15.4k jobs in February, slightly under the consensus projection for 21k, but in a series as volatile as this one, basically a hit. The increase was enough to pull down the unemployment rate to 5.8% – regaining its pre-recession trough. The tight labor market has been supportive of wage growth, which edged down slightly to 3.1% year-on-year from a robust 3.3% in January.
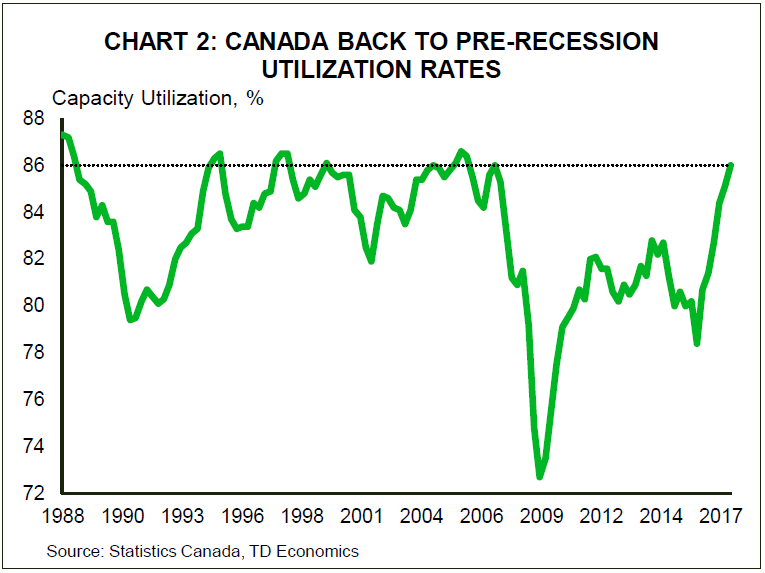
Evidence that the economy is running up against capacity constraints was also revealed in the capacity utilization data reported this week. Overall industrial capacity utilization hit its highest level in over a decade in the fourth quarter of 2017. The rise was broad-based across industries and came despite healthy growth in business investment in the same quarter. Within manufacturing, capacity utilization hit its highest level since 2000. High utilization should support ongoing investment, providing some offset to the trade uncertainty weighing on the outlook. 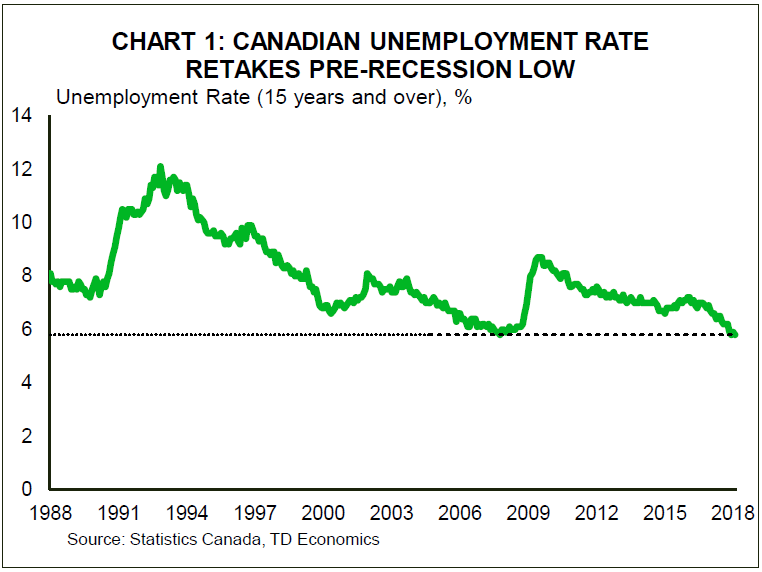
U.S.: Upcoming Key Economic Releases
U.S. Consumer Price Index - February
Release Date: March 13, 2018
Previous Result: 0.5% m/m, 2.1% y/y
TD Forecast: 0.2% m/m, 2.2% y/y
Consensus: 0.2% m/m, 2.2% y/y
We expect headline CPI inflation to accelerate to 2.2% y/y in February, with prices up a seasonally adjusted 0.2% m/m. Energy prices should be a small net positive, led by higher gasoline prices. We also see scope for a stronger pickup in food prices, as presaged by higher import prices. Excluding food and energy, we expect core CPI to print a solid 0.2% m/m increase, moderating from the previous 0.3% print. With imported consumer price inflation still benign, we do not look for the strength in January to be repeated. We also expect some oneoffs from the previous month to correct, such as the apparel category (+1.7% m/m in January).
U.S. Retail Sales - February
Release Date: March 14, 2018
Previous Result: -0.3%, ex-auto 0.0%
TD Forecast: 0.2%, ex-auto 0.3%
Consensus: 0.3%, ex-auto 0.4%
We expect retail sales to rise 0.2% in February, with the control group up 0.3%. Gasoline station receipts and auto sales should have neutral contributions. One downside risk is the late start to the tax refund season, which pushed refunds into March. The modest gains would be consistent with real PCE tracking slightly below 2%.
Canada: Upcoming Key Economic Releases
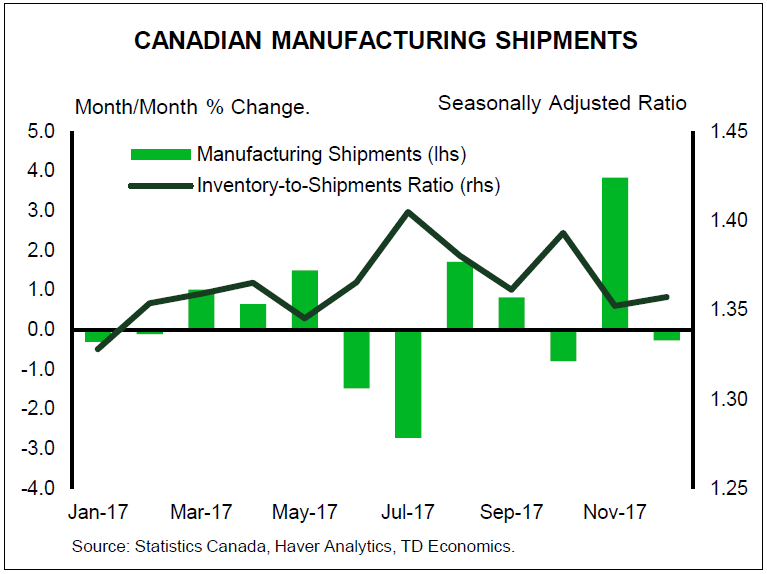
Canadian Manufacturing Sales - January
Release Date: March 16, 2018
Previous Result: -0.3% nm/m
TD Forecast: -1.0% m/m
Consensus: N/A
January is shaping up to be another slow month for Canadian manufacturers, with headline sales forecast to decline 1.0% m/m. Disruptions to auto production will once again play a part due to shutdowns at an Oshawa plant, which should drive a sharp decline in transportation equipment sales. Meanwhile, the broad decline in exports bodes poorly for factory output as a whole. Energy should provide an offsetting source of strength on higher prices for refined products though we see headwinds to forestry products after the US resumed collecting duties on softwood lumber. Volumes should come in below the headline print due to higher factory prices, driven largely by gasoline, which will come at the detriment to Q1 GDP tracking.
Dollar Mixed Ahead of Retail Sales, Inflation and North Korea Meeting
The US dollar ended up mixed against major pairs after the release of the U.S. non farm payrolls (NFP) report for February and news of a potential meet up between North Korea and American leaders. The NFP was a mixed bag with a monster 313,000 jobs gain but underperforming wage growth at 0.1 percent. US President Donald Trump tweeted about a meeting with Kim Jong Un being planned which capped a difficult week for US international relations after the steel and aluminum tariffs could be a non starter as a long list of nations are demanding exceptions.
- US worker wages missed despite massive jobs gains in February
- US inflation expected to slowdown
- US retail sales forecasted to bounce back
Dollar Mixed on Strong Jobs but Tame Wage Growth
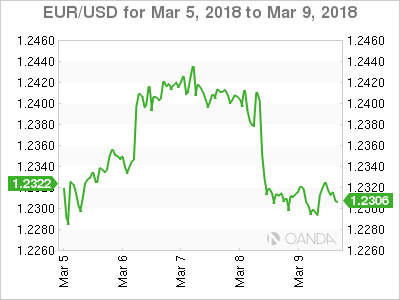 The EUR/USD lost 0.07 percent in the last five days. The single currency is trading at 1.2307 and its trading near where it opened on Monday. The EUR started the week appreciating versus the USD but it all took a U-turn on Thursday. The European Central Bank (ECB) kept rates and quantitive easing unchanged but did remove mention of adding more stimulus if the economy needed it. ECB President Mario Draghi was neutral with his comments as he praised rising European growth but also mentioned slow inflation and trade challenges ahead.
The pair stayed close to 1.23 after the NFP jobs report came out. The big gains in the number of jobs were more than offset by the low wage growth component. The lack of inflationary pressure will add ammunition to the doves within the Federal Open Market Committee (FOMC). The market still expected an interest rate hike on March 21, with 86 percent probably of a 25 basis points lift putting the range in 1.50–1.75 percent.
Next week will be more quiet with US inflation and retail sales to dictate the pace of the US dollar. Inflation anxiety has derailed stock market gains as rising costs of living would validate the Fed’s tightening policy and spell an even more rapid rise of interest rates. The consumer price index data will be published on Tuesday, March 13 at 8:30 am EDT. Retailers are hoping for a rebound on the last two months. Retail sales will be released by the Census Bureau on Wednesday, March 14 at 8:30 am EDT.
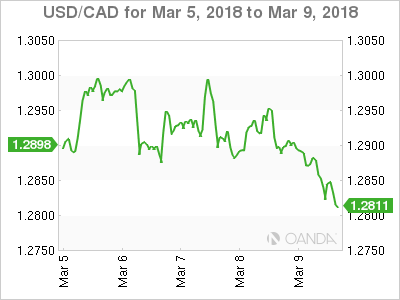 The USD/CAD lost 0.43 percent during the week. The currency pair is trading at 1.2829 after both Canada and the United States released employment reports for the month of February. The US added a massive 313,000 jobs last month, but investors were focused on the hourly earnings, which fell below expectations to 0.1 percent and the previous month’s data was also revised downward. Given the market anxiety with inflation this is a wrench in the plans of the U.S. Federal Reserve.
Canadian jobs came in below expectations with 15,400 positions instead of the forecast of 21,300 but they were enough to drive the unemployment rate lower to 5.8 percent. Concerns remain about the rise of part time jobs at the expense of full time positions. The loonie appreciated on a solid report, specially given last month’s drop of 88,000 jobs and the sell-off of the dollar that also put oil prices higher.
Bank of Canada (BoC) Governor Poloz will speak at Queen’s University on Tuesday, March 13 at 9:15 to deliver a very timely speech titled: “Today’s Labour Market and the Future of Work”. In the latest employment report it was clear the government was the biggest driver of employment with 50,300 jobs. It seems the job market like the rest of the Canadian economy is showing signs of the anticipated slowdown in the fourth quarter of 2017 with the BoC not in a rush to hike interest rates.
The CAD has had a horrible start to 2018 and is down 2.51 percent against the USD year to date as the uncertainty of the fate of NAFTA lingers with the 8th and final round to take place at the end of the month. The Canadian economy is slowing down, which in turn will make it less likely the Bank of Canada (BoC) keeps pace with the Fed’s rate hike path. With Canada being exempt from the steel and aluminum tariffs the threats from the Trump Administration are less credible, but that does not mean NAFTA is out of the woods yet as the White House can still push a unilateral move however unpopular it might be even within the Republican party.
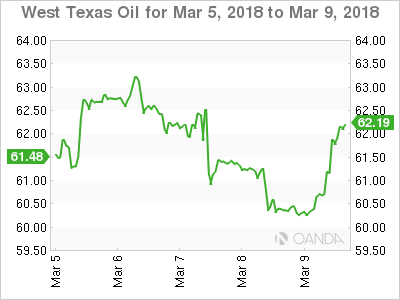 Energy prices bounced back on Friday and recouped most of the losses from earlier in the week. A 2 percent gain in the last day of the trading week took West Texas Intermediate to trade at $62.16. Oil prices started a weekly downward trend on Tuesday as inventories were coming out with confirmed buildups. The Energy Information Administration (EIA) weekly crude stocks report on Wednesday came in at 2.4 million additional barrels. The biggest factor keeping energy prices under pressure has been increase of supply concerns about US shale producers.
The EIA expected US crude production to reach 11.17 million barrels per day in the fourth quarter of 2018. This level of supply would put the US in the number one spot, overtaking Russia as the biggest producer. Russia and Saudi Arabia are part of the Organization of the Petroleum Exporting Countries (OPEC) crude output cut agreement along with other major producers. This has allowed US producers to ramp up production to take advantage of the stability in prices. Weather disruptions have impaired the ramp up in output, but analysts are tracking that potential surge in supply and see more downside for energy prices despite the best efforts of Russia and OPEC producers.
Market events to watch this week:
Tuesday, March 13
- 6:30am GBP Annual Budget Release
- 7:30 am USD CPI m/m
- 7:30 am USD Core CPI m/m
- 9:15am CAD BOC Gov Poloz Speaks
- 9:00pm CNY Industrial Production y/y
Wednesday, Mar 14
- 3:00am EUR ECB President Draghi Speaks
- 7:30am USD Core Retail Sales m/m
- 7:30am USD PPI m/m
- 7:30am USD Retail Sales m/m
- 9:30am USD Crude Oil Inventories
- 4:45pm NZD GDP q/q
Thursday, Mar 15
- 3:30am CHF Libor Rate
- 3:30am CHF SNB Monetary Policy Assessment
Friday, Mar 16
- 7:30am USD Building Permits
*All times EDT
Jobs no FX Game-Changer
Today’s release of the US February jobs report may be exactly what stocks bulls wanted in the way of goldilocks economic growth. Steady tightening in labour markets without inflationary growth in pay growth. The 313,000 increase in non-farm payrolls was the highest since July 2016, the unemployment rate held at 4.1% for the fifth consecutive month, while average hourly earnings growth eased to 2.6% y/y from the market-shaking 2.9% --which was revised down to 2.8%.
No game-changer for the Fed
It may be too early to write about this month’s FOMC meeting, which carries a 100% chance of a 25-bp rate hike in the Fed Funds rate target. But the more important question is will the Fed’s dot plot shift members’ views in favour of four Fed hikes for the year from the current three hikes. Today’s earnings data suggests that will not be the case.
Recall that the 2.9% y/y rise seen in the January earnings was emerged with scepticism due to weather-induced decline in average weekly hours. The subsequent pullback to 2.6%, coupled with the fact that the Fed’s inflation target remains at 1.5% does not call for an upgrade in the pace of Fed tightening.
No game-changer for USD
Since FX markets run on expectations, nothing in today’s jobs report or recent US data provide traders to alter their outlook based on faster Fed tightening. Thursday’s ECB press conference highlighted how the central bank faces increasing difficulty at convincing the world that plenty of accommodation remains. In contrast, Fed hawks are at difficulty in justifying faster tightening at a time when the ascent in earnings may reflect a possible end-of cycle phenomenon – a lagging indicator in labour markets.
Today’s report is a fresh confirmation of the status quo (3 Fed hikes in 2018) instead of increasing the odds of a 4th rate hike. With core PCE steady at 1.5% and ascending bond yields looming large over an aggressive Treasury borrowing schedule, it best to not rock the boat. EUR/USD remains closer to $1.35 than it is to $1.15.
Week Ahead – US Inflation and Retail Sales in Focus; New Zealand GDP also Eyed
It will be a relatively quiet week in terms of economic data over the next seven days, with the exception of the United States where inflation and retail sales figures will attract plenty of attention. The schedule for central bankers will also be lighter but not totally void as the Swiss National Bank holds a regular policy meeting.
Japan reports producer prices and machinery orders
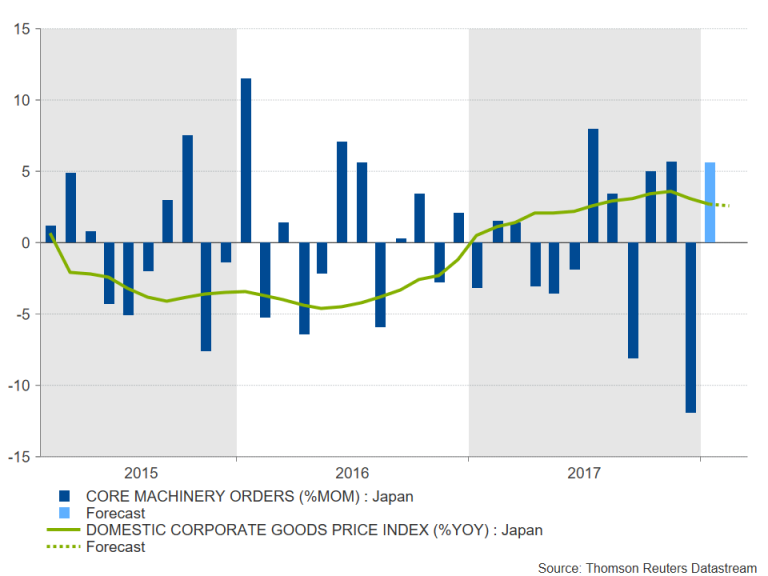
The Bank of Japan kept monetary policy unchanged this week and reaffirmed its commitment to maintain its extensive stimulus program at least until the 2% inflation target has been met. Producer price data out of Japan on Tuesday are expected to show there is little imminent threat of an upsurge in inflationary pressures. Corporate goods prices are forecast to rise by just 0.2% month-on-month in February, with the annual rate declining marginally to 2.6%. Core machinery orders – a key measure of future capital spending – will follow on Wednesday. Orders slumped by 11.9% m/m in December. Another poor month in January could spark some concerns about the Japanese manufacturing outlook over the coming months. However, this is unlikely to have a significant impact on the yen and not much reaction is expected either from the minutes of the BoJ’s January meeting minutes due on Wednesday.
 Lunar New Year likely boosted retail sales in China
Retail sales in China are expected to have picked up to 9.8% year-on-year in February from 9.4% the prior month, with spending possibly getting a lift from the Lunar New Year celebrations. The boost is not expected to apply to industrial output however, which is forecast to slow from 6.2% to 6.1% y/y. Fixed asset investment is also expected to moderate in February. Stronger-than-anticipated growth in industrial activity should not be discounted though given the surge in exports during the month.
New Zealand GDP eyed
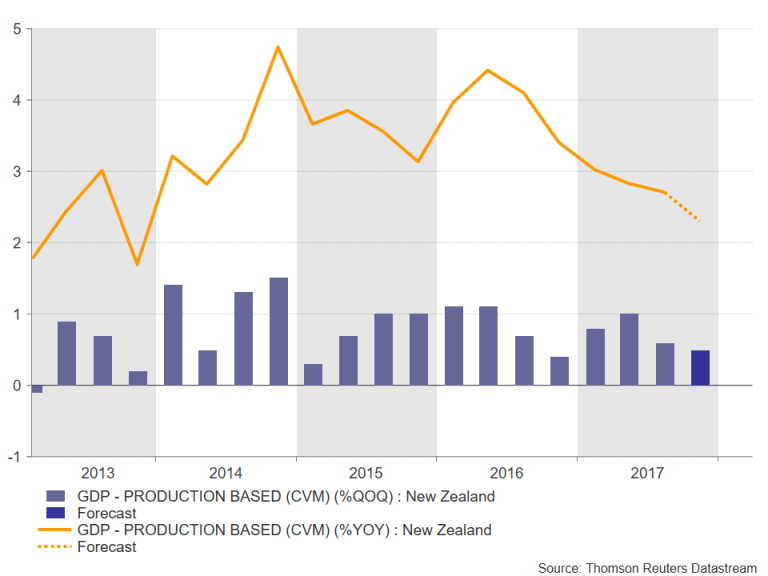
The New Zealand dollar has been consolidating since late January as weak inflation data and market turbulence have put a lid on the kiwi’s 6-week old rally. Fourth quarter GDP figures on Thursday could inject some fresh upside momentum to the kiwi/dollar pair if there’s a positive surprise. New Zealand’s economy is expected to have expanded by 0.5% quarter-on-quarter in the final three months of 2017, slightly below the prior quarter’s 0.6% rate. However, with both employment and trade numbers beating expectations in Q4, a stronger reading is possible. A disappointing figure on the other hand would add to the growing number of analysts expecting the Reserve Bank of New Zealand to stave off from hiking rates until the second quarter of 2019.
 SNB meeting to headline light calendar week in Europe
After a dovish Mario Draghi drove the euro to below $1.23 at this week’s European Central Bank meeting, there’s little in the form of data to give the single currency a helping hand up. Industrial production for January (Wednesday) and final CPI figures for February (Friday) will be the only major releases out of the Eurozone next week. Euro area labour costs for the fourth quarter may also attract some attention on Friday.
Investors’ focus will instead turn to the Swiss National Bank and the Norges Bank as the Swiss and Norwegian central banks meet to set interest rates. The SNB is expected to keep its target for the 3-month Libor rate at between -1.25% and -0.25% on Thursday. A stronger-than-expected CPI reading for February out of Switzerland this week is unlikely to prompt the SNB to signal a rate hike. SNB Chairman Thomas Jordan still considers the Swiss franc to be “highly valued” despite the euro’s 10% appreciation versus the Swissie over the past year.
In Norway, policymakers have been having less success with inflation as core inflation in the country has moderated substantially since 2016 to below 2%. However, CPI data released this week showed an unexpectedly stronger-than-expected pick up in February, boosting the Norwegian krone. Rates are forecast to be kept on hold at 0.5% on Thursday, but the Norges Bank could bring forward the timing of a rate hike in its latest projections.
US inflation and retail sales back in limelight
The US dollar managed to regain some footing this week as Korean geopolitical risks and trade war fears abated. Economic indicators out of the US next week have the potential to extend the greenback’s recovery as price and consumer spending gauges come to the forefront. The CPI report is first up on the calendar on Tuesday. The headline inflation rate is forecast to edge up to 2.2% y/y in February, while the core rate is also expected to advance by 0.1 percentage points to 1.9%. On Wednesday producer prices and retail sales figures will keep traders busy. After a 0.3% m/m drop in January, retail sales are anticipated to bounce back by the same amount in February.
 Manufacturing activity surveys for New York and Philadelphia will be watched on Thursday. The New York Fed’s Empire State manufacturing index is forecast to rise in March, but the Philly Fed manufacturing index is expected to fall slightly in the same period. Housing indicators are due on Friday as figures on building permits and housing starts for February are published. Also out on Friday are industrial production data and the University of Michigan’s consumer sentiment gauge. Industrial output is set for a 0.3% m/m rebound in February, following a 0.1% dip in January, while the preliminary reading of the UoM consumer sentiment index is expected to move slightly lower from 99.7 to 99.4 in March.
5 Fronts of Trump’s Trade War
Donald Trump signed a proclamation to place tariffs on steel and aluminum on Thursday in the first concrete step in his quest to reduce the bulging US trade deficit. The resulting steps as well as fallout will be a driving force for markets in the weeks/months ahead.
Major decisions on retaliation, exemptions and strategy are coming. Here are five areas to watch.
1. The Timeline
Trump’s declaration exempted Canada and Mexico but put all other countries on the clock. They have 15 days to convince the US administration not to tax their steel imports. Trump singled out Australia as it could be spared, indicating defense procurement may be a factor in decision. Exemptions from Trump’s tariffs will have FX implications, but if such reprieves multiply, then it bodes well for risk trades at the expense of the yen.
2. Who Replaces Cohn
The first casualty of the trade war was White House economic advisor Gary Cohn, who resigned Tuesday of the tariffs. Expect Trump to name his replacement in the week ahead. Who he chooses could help signal his agenda into the November mid-term elections and beyond. Cohn made a push for Shahira Knight, widely considered as a moderating voice. Another possibility is former Reagan economist Larry Kudlow whom Wall Street would support. Nonetheless, trade hawk Peter Navarro is also angling for the job, and choosing him would signal that these tariffs are here to stay. Worthy of note, Navarro is especially critical of the trade relationship with Canada.
3. Retaliation
The EU has taken an aggressive stance towards US aluminum and steel tariffs, which raises the possibility it will retaliate rather than aim for an exemption. China will certainly not be granted an exemption – it wait until the 15-day period runs out to see if Trump acts. Alternatively, Beijing may pre-announce retaliatory measures in the hopes of getting the White House to back down. Countries can also file a complaint against the US at the World Trade Organization, to which the US will appeal on the argument that is protecting national security. The entire process could take 1-2 years, during which, complaints, lawsuits and trade barriers will dominate world trade.
Uncertainty is high and many trade partners will be affected but action is assured. And if action comes, the next big question will be how the US reacts.
4. NAFTA
Mexico and Canada got a reprieve Thursday but the timeline is indefinite. The idea of a 30-day exemption for Mexico and Canada was floated, suggesting the US is growing impatient with the progress of NAFTA talks. The Mexican Presidential election in July also means talks need a quick finish or they will go on hiatus. Trump said Thursday he was optimistic about a deal but there has been no progress on the thorny parts of a deal. Ultimately, aside from saying things like “NAFTA is the worst trade deal ever”, Trump is reluctant to address any specific problems with the Agreement, leaving him a window to carve out a deal that’s largely the same while declaring victory.
5. The Trade Deficit
A headline that was ignored this week was a surge in the US trade deficit to a nine-year high. It’s rising because of a strengthening US demand and a tax plan that’s added further stimulus to an economy already near full capacity. In all-likelihood it will continue to rise. As it does, it will infuriate and embarrass the President and he’s likely to unveil further haphazard ways to fight it. That means this story isn’t going to go away as long as Trump is in the White House.
Usually the story goes like this: As long as the world economy is growing in synch, the US trade deficit will move towards 3% of GDP, the budget deficit towards 4% of GDP and the US dollar would have little choice but to pull lower. At least that’s what the chart shows.
Australia & New Zealand Weekly: Prospects for the Australian Economy; Markets; and Global Risks
Week beginning 12 March 2018
- Prospects for the Australian economy; markets; and global risks.
- RBA: Deputy Governor Debelle, Assistant Governors Bullock and Kent speak.
- Australia: Westpac-MI consumer sentiment, AusChamber-Westpac survey, housing finance, NAB business survey.
- NZ: Q4 GDP, current account, house sales.
- China: new finance, retail sales, foreign direct investment, industrial production.
- Euro Area: ECB Draghi speaks.
- US: CPI, retail sales.
- Key economic & financial forecasts.
Information contained in this report current as at 9 March 2018.
Prospects for the Australian Economy; Markets; and Global Risks
I am visiting customers and officials in Hong Kong; Beijing and Singapore next week.
I set out below the Executive Summary of the 70 page document I will be presenting during the visit.
Prospects for the Australian Economy; Markets; and Global Risks
As we contemplate 2018 there are a number of key themes that we believe will dominate economic and market developments. Our advice to customers throughout 2017 has been to expect Australia's growth rate to likely be anchored below trend in both 2018 (2.7%) and slowing to 2.5% in 2019. That has contrasted with official forecasts (Reserve Bank and Treasury) which anticipate growth picking up to 3.25% in both 2018 and 2019.
We have recognised a solid ongoing boost to growth from non– residential construction; government investment (especially at the state level) and exports. However we are much more cautious than official forecasts on the consumer; residential construction and equipment investment.
Slowing household incomes
Signals from the December quarter national accounts are more encouraging for the official view. Household spending has been revised up from an expected 2.1% to 2.9% following the release of the December quarter national accounts. This picture of households has changed from "lacklustre" to "slightly below trend". However this was associated with a weak savings rate of 2.7% despite a boost in nominal labour income growth to 4.8% for the year largely due to an extraordinary lift in hours worked of 3.5%. With hours worked increasing so rapidly, labour income growth should have been boosted further but was constrained by wages growth and a drift to lower paid jobs – non-farm compensation per employee remained flat in the December quarter to be up an insipid 1.8% for the year.
Labour productivity fell over the year with GDP per hours worked falling by 1% over the year and unit labour costs growth lifting to 2%. This adverse development in labour productivity is likely to temper the recent strong demand for labour we experienced in 2017.
It is therefore our expectation that there will be a slowdown in the current break neck pace of growth in hours worked over the course of 2018 and into 2019. Weak wages growth and the drift to lower income jobs looks set to continue putting some downward pressure on growth in labour incomes. With the savings rate now probably at its lows, another year of below trend consumer spending growth can be expected.
Business investment
New business investment lifted by 5.8% over the past year, a sharp turnaround from a 6.2% decline over 2016. Over the year, infrastructure work fell 1.2%; non-residential building advanced 12.3% and equipment investment spending increased by 8.4%.
Mining equipment investment lifted by 31% over the year, reflecting the final fit out of three major projects. It is more encouraging that non-mining equipment investment lifted by 6.2% over the year following a slowdown in 2016 partly associated with the uncertainty around the 2016 election. With another Federal Election due by May 2019 and even greater uncertainty associated with that election (conservative government was expected to win the 2016 election whereas the Labour opposition is comfortably ahead in the current opinion polls), we may start to see equipment investment run into some headwinds from the second half of 2018.
Housing downturn
Dwelling investment contracted in 2017 by 5.8%. Based on the downturn in the trend in high rise approvals and a flat outlook for detached housing, we expect this downturn has further to run with the contraction accelerating into 2019. Oversupply and a marked slowdown in sales to foreigners are weighing on the outlook for residential building. House price inflation is disappearing. On a six month annualised basis, prices are now falling in Sydney and Perth and slowing in Melbourne and Brisbane.
The regulator's macro prudential policies are restricting interest only loans and tighter guidelines for all new loans are slowing house prices and credit growth. In previous cycles the authorities have relied on raising interest rates to slow the highly cyclical housing market. This time, the same effect has been achieved by the regulator as banks have independently raised loan rates; foreign demand has slowed; and regulations have significantly squeezed the availability of credit.
Furthermore, the attractiveness of investment properties has diminished. Land taxes and lacklustre rental growth have tightened rental yields. Prospects of adverse tax changes in the event of a change of government are also impacting investor confidence. Most banks are predicting rate increases while the alternative government is planning to reform some aspects of investor taxes.
We expect a long extended period of flat house prices on a national basis with weakness particularly centred on the Sydney and Melbourne markets. This will represent a considerable change in the "atmospherics" around housing wealth and may weigh further on prospects for consumer spending.
Inflation below target
Inflation is also likely to remain benign holding a little below the bottom of the Reserve Bank's 2–3% target band. In this regard we are in broad agreement with the Reserve Bank which is forecasting that underlying inflation will hold at 1.75% in 2018 before lifting modestly to 2% in 2019. Note that underlying inflation has held below the 2–3% target band in 2015; 2016 and 2017.
With underlying inflation likely to therefore register five consecutive years at or below the bottom of the target range it is reasonable to argue that Australia is experiencing a structural fall in inflation. Arguably, without the risk of overheating the housing market, interest rates would have been even lower in Australia in recognition of this structural fall and the disappointing progress in restoring inflation to the target range.
Interest rate outlook
We have been of the view through 2017 that the official cash rate will remain on hold in both 2018 and 2019. With rates on hold in Australia and the US Federal Reserve continuing to raise rates, Australia's cash rate is set to fall below the Federal Funds rate by March. By end 2018, it is set to be 63 basis points below the Federal Funds Rate, and by end 2019, 112 basis points below the Federal Funds Rate.
Sustained period of negative Aus–US rate spreads
The US economy is operating with much less 'slack' in its labour market (unemployment rate of 4.1% compared to an estimated full employment rate of 4.5%) than Australia (unemployment rate of 5.5% compared to a full employment rate of 5.0%) but, to date, wage pressure has only recently emerged (three month annualised pace has lifted to around 4%).
Of most concern to markets has been the planned lift in government spending ($300 billion over 18 months) and the Tax Cuts ($1.5 trillion over 10 years) in the US. These policies are likely to boost the Budget deficit by around 2% of GDP providing a solid boost to demand when the economy is already operating at full capacity in the labour market.
We expect three 25 basis point hikes in March, June and September from the FED. That would see the USD/AUD yield differential in the overnight market contract to minus 63 basis points – a situation we have not seen since early 2000. A further two hikes are expected in the first half of 2019.
AUD/USD Bond Spread
Back in August 2017, Westpac had been forecasting that AUD cash rates would fall below the US Federal Funds Rate by around 40 basis points by end 2018. That, in turn, would drive the 10 year bond spread to zero, from around 60 basis points. At that time markets were priced for the US rate to be around 35 basis points below Australia. We now expect RBA rates to be even lower than Federal Funds at minus 63 basis points by end 2018 and minus 112 basis points by mid-2019. The likely result is that AUD 10 year bonds will trade around 30 basis points below US bond rates by mid-2019.
Commodity Prices; China; and the Australian Dollar.
Amid general euphoria around the global economic outlook we suggest caution. The Chinese economy is generally expected to slow as consumption and net exports are unable to compensate for the ongoing slowdown in investment. However, the big uncertainties and risks continue to centre around the Chinese financial system.
Much has been made of the synchronised lift in global growth in 2017. From Australia's perspective the key development has been the faster than anticipated growth in China. China's growth rate printed 6.9% in 2017 but we anticipate a decent slowdown in 2018 to 6.3%.
China realises that it must move away from its growth model based on exports and investment. In particular the role of the financial sector must change from channelling high savings at low cost to strategic sectors, to facilitating China's economic transformation to a more sustainable model based on services and consumption. But the "old" model has resulted in financial assets growing from 260% of GDP in 2011 to 470% in 2016 (IMF, 2017). The excessive growth (around 30% per annum over the last 10 years) has been in the largely unregulated non–bank sector.
In November, President Xi nominated poverty; pollution and financial leverage as his key "challenges". We expect that the slowdown in growth in the non-bank sector will weigh on commodity prices as speculators are squeezed for funding and local governments, in particular, are restricted in their access to funding for new infrastructure projects.
We are already seeing some evidence of this squeeze on the non– bank sector. Banks are no longer allowed to guarantee wealth management products; entrusted loans (corporates borrowing to lend to other corporates with banks operating as agents) have been banned; rapid growth in short term interbank funding has been slowed; and general funding for wealth management products is being restricted.
These forces are likely to weigh on iron ore and coking coal prices. Some lift in supply from Australian producers is also expected to lower prices. These atmospherics for commodity prices along with the widening interest rate differential are eventually expected to weigh on the AUD. We recognise that capital flows are also critical to the AUD's prospects. In forecasting, we have endeavoured to accommodate any direct impact of capital flows that is not explained by rates and commodity prices.
We target AUD at USD 0.74 by end 2018 and 0.70 by end 2019.
The week that was
The market has had a lot to ponder, from growth and funding in Australia to trade frictions and rate expectations elsewhere.
In the National Accounts, Australia received one of its preeminent quarterly releases this week. GDP growth in the December quarter was disappointing at just 0.4% and 2.4% over the year, annual growth down from 2.9%yr in Q3 and below its trend pace of 2.75%yr. Of note however, while the headline outcome was sub-par, the detail was constructive. The main negatives in the release were temporary in nature: a 0.5ppt subtraction from net exports and a 1.0% decline in business investment associated with the winddown of the mining investment boom. Residential construction is an enduring negative (-1.3, 5.8%yr), but one that is offset by the ongoing strength in public demand (1.1%, 4.9%yr).
Most notable for the outlook was an above expectation gain for household consumption (+1.0%yr), and a revision to the prior quarter, from 0.1% to 0.5%. Opportunity for further solid gains in consumption was also seen in the lift in nominal labour income growth to 4.8%yr, the strongest annual gain since mid-2012. These outcomes will provide some comfort to the RBA, being representative of the successive outcomes necessary to see growth lift from below to above trend in 2018. We instead continue to believe that headline growth will hold below trend in 2018 and 2019 as the consumer holds back; business investment takes time to accelerate; and residential construction remains a negative.
Ahead of the GDP release, the balance of payments provided an update of how we fund ourselves as a nation. Historically Australia has funded persistent current account deficits by our banks borrowing funds offshore and on-lending the funds domestically. Post-GFC however, reduced domestic appetite for bank credit and stronger growth in deposits has limited the need for banks to borrow offshore. Rather, the current account has been funded by the purchase of Australian assets by foreign investors.
This flow of capital grew rapidly during the mining investment boom. But foreign investors' appetite for Australian assets has persisted since, broadening across the entire economy. This capital offered additional support to the Australian dollar. In the second half of 2017 however, it is evident that direct investment's support for the dollar decelerated materially. Should this nascent trend persist, it will be another reason for the AUD to depreciate to USD0.70 by September 2019 as we expect, in addition to declining commodity prices and the Australian/US interest rate differential. Offshore, trade and rate expectations have been in focus this week.
Since US tariffs on steel (25%) and aluminium (10%) were announced by President Trump at the beginning of March, financial markets have been unsteady. This was all the more the case after a separate targeted action against China for "alleged theft of intellectual property" was mooted and a potential retaliation by Europe against the US (targeting prestige US brands such as Harley Davison) was reported. For the US economy, trade sanctions could derail the benefits of tax reform, particularly with respect to investment. While for the globe, the threat comes at an inopportune time, as a number of indicators of economic momentum begin to plateau (at elevated levels).
Parallels have been drawn to 2002 when then President Bush imposed a tariff in excess of 30% on steel that was met by retaliatory action from other countries. That decision was followed by a sharp fall in the US dollar and US equities. However in 2002, equities had already been moving lower for more than a year after the tech bubble burst and amid 2001's very weak economic growth. With the US economy currently on a strong footing, today's circumstances are very different. We remain of the view that global economic strength and diplomacy will win out, and this will allow the FOMC to continue raising interest rates in 2018, most likely three times. Supporting this view, Atlanta Fed's Bostic stated this week that he has upgraded his fed funds rate view for 2018 from two to three hikes despite headwinds from 'trade frictions'.
ECB President Draghi provided financial markets with a number of salient points to ponder this week. In response to the continued strength of the Euro Area economy, the reference to potentially increasing the scale of the purchase program was removed from the statement – a first (small) step towards policy being tightened. However, he and the Governing Council also very clearly highlighted that conditions are not yet conducive to policy being tightened. For that to occur, "a sustained adjustment in the path of inflation consistent with its inflation aim" is necessary.
What Draghi said about fiscal policy in Europe and beyond was equally as important. There was a two-part call: to step-up structural reforms; and make use of current momentum to build a fiscal buffer for future use. Draghi was also unusually forthright on President Trump's tariffs. Opining that "If you put tariffs against what are your allies, one wonders who the enemies are" in Q&A highlights the ECB's and Europe's opposition to Trump's policy.
Chart of the week: Consumer spending
Consumers were the main upside surprise in the December national accounts with a better than expected quarterly result and significant upward revisions. The combined effect has lifted annual growth at 2.9%yr vs our forecast estimate of 2.1%.
The big upward revision to the previously very weak Q3 estimate is particularly notable. The ABS advises that revised tourism spending estimates were the major contributor to the change. Consumption includes spending by Australians abroad and excludes domestic spending by non-residents. Q3 estimates for spending abroad were impacted by changes to passenger surveys with the 'outbound' card collection discontinued and only arrivals collected. That added 0.26ppts to Q3 spending.
Note that there is no net effect on GDP due to a matching upward revision to tourism imports. It also explains why national accounts spending estimates are now much stronger for Q3 than retail sales which are unadjusted for net tourist spending.
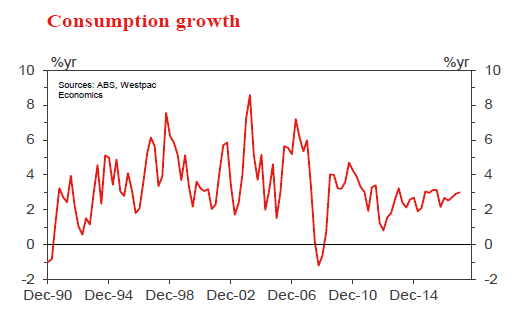
New Zealand: week ahead & data wrap
Late fade
Next week sees the release of the December quarter national accounts, the last major piece of economic information from 2017. We expect it to highlight that the New Zealand economy, while still growing, has lost some momentum over the last year.
We estimate that GDP grew by 0.6% in the December quarter. That result would bring growth over the 2017 calendar year down to 2.9%, compared to 4% growth in 2016. Population growth was similar in both years – around 2% – so this represents a substantial softening in per-capita growth.
We recognise that next week's release is not the final word on the economy's performance. A year ago, the GDP figures appeared to be saying the same thing: that growth had been strong in previous years, but more recently had slowed to barely above zero in per-capita terms. However, at the end of last year Stats NZ published revisions to the recent history of GDP, incorporating better-quality information from annual surveys. The new figures told a different story: growth had in fact remained strong, reaching its peak in 2016.
The figures for 2017 have yet to be subjected to the annual revisions process. But the reported slowdown in GDP growth matches with what else we saw going on in the economy last year – which wasn't always the case in 2016.
Firstly, the housing market was much more subdued in 2017, following a couple of years of double-digit house price gains. That flowed through into people's willingness to spend, with the rate of growth in card spending slowing over the course of the year. Secondly, construction activity flattened out last year as the building industry faced constraints on capacity and access to finance. Finally, business confidence fell over the course of 2017 – a move that began even before the new Government was formed.
Coming into this year, a slower starting point for the economy will present challenges for policy makers. Lower than expected GDP could translate into a lower tax take (though so far tax revenue has continued to surprise to the upside of the Treasury's forecasts). It also raises questions about the economy's ability to absorb the impact of the Government's policy changes, such as those around labour laws and housing market speculation. For the RBNZ, lower than expected growth would mean that the rise of home-grown inflation pressures would be delayed even further.
GDP (15 March)
Previously we were forecasting a 0.8% rise in the production measure of GDP. However, we have revised this down to 0.6%, as the last of the sectoral indicators that were published this week were softer than we expected on balance.
Building work put in place rose by 1.4% in the December quarter, a little less than our forecast. Activity continues to slow in Canterbury as the earthquake rebuild work winds down, but it is trending higher in the rest of the country. Residential building work was flat for the quarter, while non-residential building rose. We've also assumed that other construction (not covered by the building work survey) will retrace to some extent after a 9% jump in the previous quarter.
The manufacturing survey initially appeared to be positive, with a 1% rise in sales volumes. The main factor was a 17% surge in petroleum manufacturing – but this is not the measure used to calculate GDP. The manufacturing survey is based on deflated sales; this can be unreliable when oil prices move sharply, as they did in the December quarter. For measuring GDP in this industry, Stats NZ surveys production volumes directly from the major players. It's unlikely that actual volumes rose to such a degree, given that refining capacity is limited.
The remaining details in the manufacturing survey were soft on balance. Manufacturing of machinery fell back after a strong rise in the September quarter, and there were either declines or small gains in wood products, metals and minerals. Food processing was mixed, with fruit and meat up, but dairy and beverages down.
Goods turnover was relatively brisk in the December quarter, with some of the strongest gains seen in the retail, wholesale and transport sectors. However, growth in personal and business services was more subdued. The poor dairying season continued, although milk collections didn't fall short by as much as they did in the September quarter.
The expenditure measure of GDP is considered to be less reliable as a measure of quarterly growth, but the details are sometimes of interest. For the December quarter, we expect to see solid growth in household spending and business investment, but with much of the growth being serviced by imports. In particular, there was a surge in imports of plant and machinery in the December quarter (which continued into early 2018). These imports have increased the trade deficit for now, but they will add to the economy's productive capacity over time.
Current account (14 March)
The surge in imports of capital equipment will contribute to an expected widening of the current account deficit over the year to December. We expect a deficit of 2.6% of GDP, from a revised 2.5% in September.
For the December quarter, the surge in imports overshadowed a modest rise in export volumes, leading to an increase in the goods trade deficit. Trade in services remained strongly in surplus, with growth in tourist numbers both into and out of the country. The current account deficit remains well within what we would consider a sustainable range. That is, a deficit of less than 3-4% will stabilise or even reduce New Zealand's net overseas debt position, relative to GDP.
Indeed, it's remarkable that the deficit has remained at historically low levels throughout the economy's upturn. Low global interest rates have played a major part in keeping the country's net interest costs down. Stronger returns from export sectors such as tourism have also played a role.
But perhaps the most significant factor is that we haven't seen a repeat of the surge in domestic demand – largely fuelled by offshore borrowing – that characterised the economic boom of the 2000s. Increased regulation and greater caution since the Global Financial Crisis have constrained the growth in overseas borrowing, contributing to a slower but arguably more sustainable economic upswing this time around.
Data Previews
Aus Jan housing finance (no.)
Mar 13, Last: –2.3%, WBC f/c: –1.0%
Mkt f/c: -0.2%, Range: -1.5% to 1.0%
- Australian housing finance approvals posted a soft finish to 2017, the number of approvals for owner occupiers dipping 2.3%. Approvals ex refi were down 3.4%mth but still up 2.1%yr. The value of housing finance approvals to investors also posted a decline, down 2.6% to be 10.5% lower for the year with a notably sharper fall in NSW.
- Industry figures suggest Jan was another soft month for owner occupier approvals – we expect a 1.0% decline. As always, housing data should be treated with extra caution around the summer holiday low period as seasonal adjustment can amplify monthly volatility.
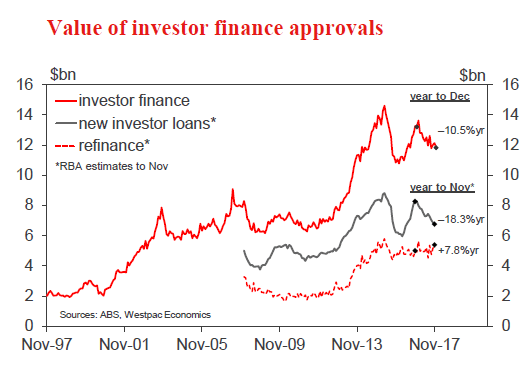 Aus Q1 AusChamber-Westpac survey of Industrial Trends
Mar 13, Last: 63.4
- The Australian Chamber-Westpac survey of the manufacturing sector provides a timely update on conditions in the sector and insights into economy-wide trends. The Actual Composite tracks a range of demand related measures including investment and employment. The Q1 survey was conducted during February and the start of March.
- In Q4, the Actual Composite moderated to 63.4 from 66.1 in Q3, after a rebound from a dip in June 2015 to 55.1. Strength is centred on a lift in new orders and output as well as increased overtime and an uplift in employment.
- Manufacturing is benefitting from a rise in public infrastructure, non-mining business investment, and stronger world growth combined with a relatively low AUD. However, moderate consumption constrained by low wage growth and intensity from offshore competition are headwinds.
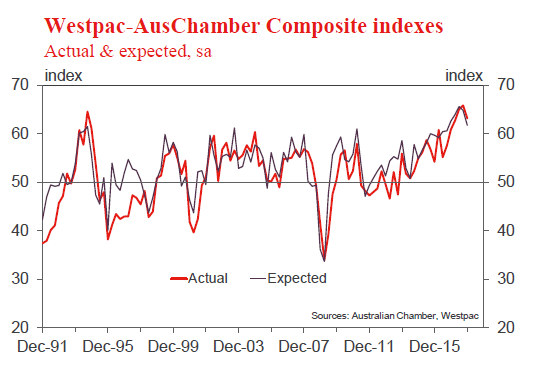 Aus Mar Westpac-MI Consumer Sentiment
Mar 14 Last: 102.7
- The Westpac-Melbourne Institute Consumer Sentiment Index fell by 2.3% to 102.7 in Feb from 105.1 in Jan. The Feb survey was conducted amid a wave of volatility across global financial markets. Under the circumstances, the slight fall in sentiment is a decent result, particularly given that it leaves the index in net optimistic territory above the 100 mark for a fourth consecutive month – a run that follows a twelve month stretch in which pessimists were in the ascendency for all but one month.
- The March survey is in the field over the week ended March 10. Financial markets have settled down somewhat, the ASX200 up over 2% since the Feb survey. The global backdrop remains unsettled though with increasing trade tensions. Further signs of house price declines locally are also likely to weigh on sentiment.
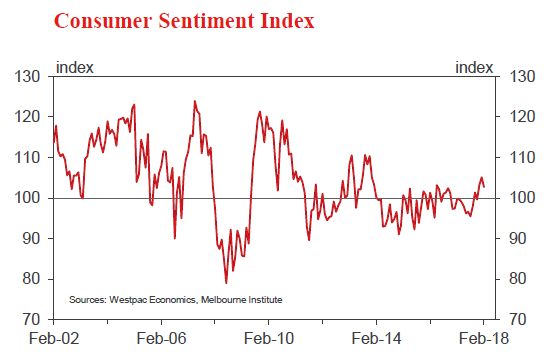 NZ Feb house sales and prices
- Due the week starting 12 March, Sales last: -2.0%, Prices last; +3.4%yr
- January's REINZ housing market data was a little softer than the preceding three months. However, housing market data can be choppy on a month-to-month basis, particularly around the holiday season. In addition, monthly sales figures tend to get revised higher over time. We we still think that the housing market best characterised as enjoying a bit of a resurgence at present, following a drop in mortgage rates in late-2017 and the passing of the election.
- With fixed mortgage rates falling further in recent weeks, and the Reserve Bank slightly easing its LVR mortgage lending restrictions, we expect the current market buoyancy to continue for a few more months.
- However, later this year we expect fixed mortgage rates to start increasing, and the Government's policy program of cooling the housing market will bear on the market. We expect that these conditions will see the housing market slow through the back half of 2018.
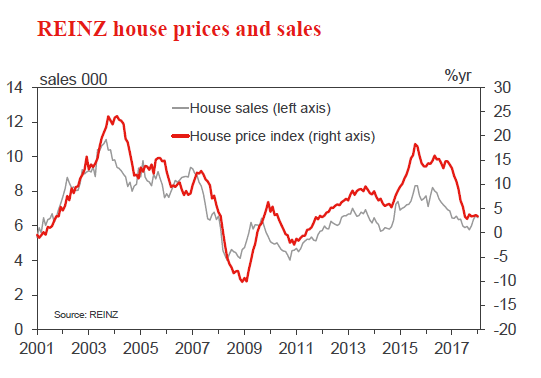 NZ Q3 current account, % of GDP
Mar 14, Last: -2.5%, Westpac f/c: -2.6%
- We estimate that the annual current account deficit widened slightly to 2.6% of GDP.
- In seasonally adjusted terms, the goods trade deficit is expected to have widened by about half a billion dollars in the December quarter. A modest rise in export volumes was overshadowed by a surge in import volumes, led by imports of capital equipment and vehicles (including two more Boeings for Air New Zealand's fleet).
- The services surplus was broadly unchanged in the December quarter. There was strong growth in tourist numbers both into and out of the country.
- We expect a slight narrowing of the investment income deficit for the December quarter, with a pullback in profits of overseas-owned firms after a few unusually strong quarters.
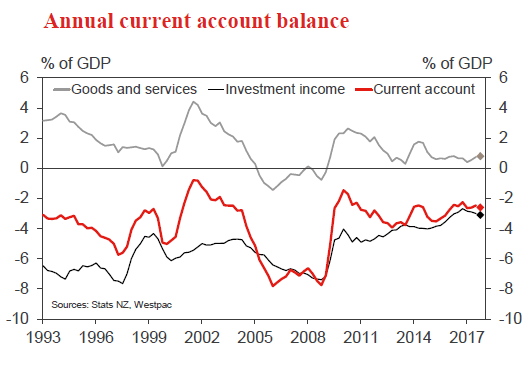 NZ Q4 GDP Production-based GDP
Mar 15, Last: 0.8%, Westpac f/c: 0.6%, Mkt f/c: 0.6%
- We expect a 0.6% rise in the production measure of GDP. That compares to an average growth rate of 0.8% over the previous three quarters of 2017. With population growth still running strong at about 0.5% a quarter, this would mark the second quarter when growth has been barely above zero in per capita terms.
- There are no obvious one-off factors driving the quarterly result, just modest growth across a range of sectors. Retail and wholesale turnover were relatively brisk, but the services sectors were generally subdued, milk production fell, and the construction sector faced constraints on growth.
- For the year as a whole, we expect the growth rate to slow to 2.9%, compared to a peak of 4% growth in 2016.
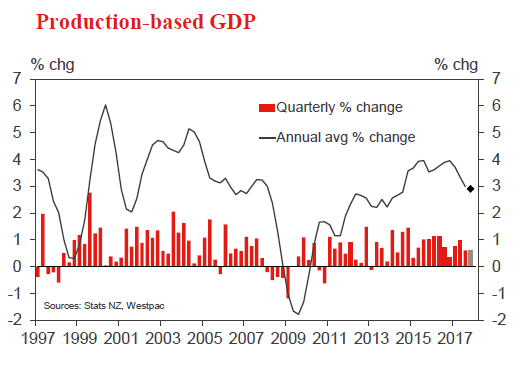 US Feb CPI
Mar 13, last 0.5%, WBC f/c 0.3%
- The January headline monthly outcome of 0.5% was the strongest since early 2013 and materially above target if annualised. That said, a similar gain a year ago dropped out of the annual growth calculation, leaving it unchanged at 2.1%yr.
- A large contributor to inflation in the month, and indeed over the past six, was energy prices. In January, the energy index rose 3.0% as gasoline prices gained 5.7%.
- That said, a noticeable acceleration in core inflation (ex food and energy) has also been evident. Having recorded a 1.1% annualised gain in the six months to July 2017, core inflation has since accelerated to a 2.6% pace.
- Come February, energy won't be a key contributor, but core pressures will remain, resulting in a price gain circa 0.3%.
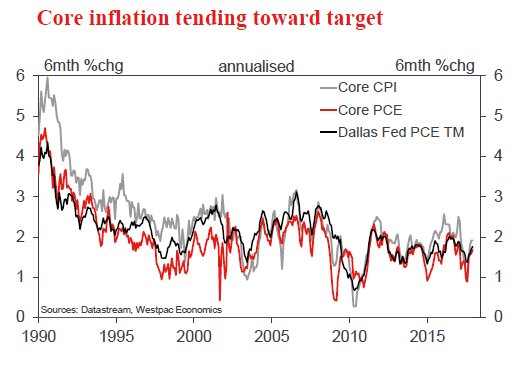 US Feb retail sales
Mar 14, last -0.3%, WBC f/c 0.4%
- Retail sales were a major disappointment in January, recording the weakest outcome in 11 months as households cut back on auto purchases and building materials. A downward revision was also made to the December outcome, exaggerating the weakness.
- It is worth noting that, excluding these more volatile items, core retail sales were also soft, a flat outcome in January following a revised 0.2% decline in December. Coming at a time of strong confidence and employment growth, the outcomes jar with the market's strong narrative.
- Come February, we anticipate spending will pick up. However, at less than 5% annualised, it is an outcome best regarded as solid not strong. For consumption to accelerate further, wage inflation will have to strengthen across the economy and confidence hold up.
Weekly Focus: From Symbolic to All-Out Trade War?
Market Movers ahead
- We do not expect recent developments on trade to evolve into an all-out trade war, but to remain largely verbal. However, the central theme will be if the US takes further steps against China and the potential for escalation.
- US core CPI will come down after a number of stronger-than-expected releases.
- In China, we expect data for industrial production, retail sales and fixed asset investments to confirm the picture of a moderate slowdown.
- Euro area wage growth is expected to remain around the current level.
- In Sweden, inflation will rebound somewhat but remain below the Riksbank's forecast. We expect house prices in Stockholm to have increased in February, as purchases moved forward prior to new amortisation rules taking effect in March.
- In Norway, the main event is, of course, the rate-setting meeting at Norges Bank, where we expect the rate path to be revised up a little.
Global macro and market themes
- The ECB shrugs off political risks and moves on unabated.
- Eurosceptic win in Italy leaves political risk premium in EUR and Italian bonds under pressure.
- The ECB manages to deliver 'hawkish' shift in guidance in a soft tone.
- Trump's trade rhetoric is yet another USD negative to add to 'the list'.