Sample Category Title
USD/JPY Analysis: Shoots Up To 107.00
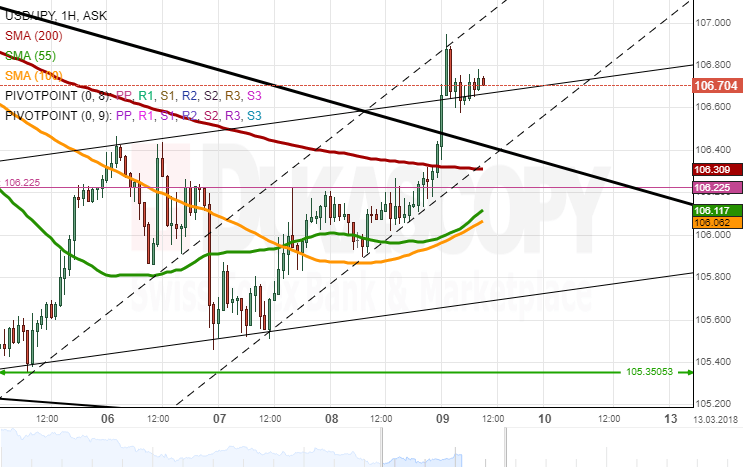
The global strength of the US Dollar put upward pressure on the USD/JPY exchange rate. The pair gained 86 pips during Thursday's trading session, thus dashing through the monthly PP, the 200-hour SMA and the upper boundary of the senior channel.
The strong two-day surge has sent technical indicators near the overbought region, so, even if some advances occur during this session, the Greenback should not exceed the 107.20 mark.
It is more likely that a bearish correction prevails in the market today and sends the pair towards the combined support of the 55– and 100-hour SMAs at 106.00.
The US employment data release could alter the market sentiment and guide the pair's direction during the remaining hours of this trading week.
GBP/USD Analysis: Falls Down To 1.38
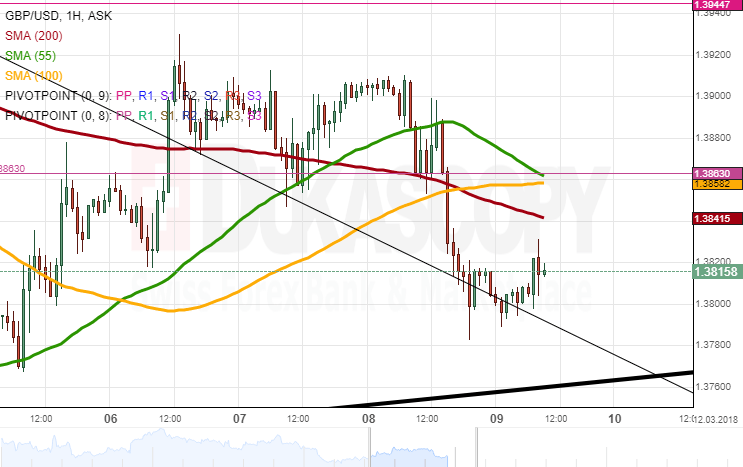
GBP/USD once again failed to surpass the 1.39 mark on Thursday, as the US Dollar strengthened in the global markets in response to the easing pressure over a trade war.
As a result, the pair breached a strong two-day support formed by the 100– and 200-hour SMAs and the weekly and monthly PPs circa 1.3860 and plunged down to the 1.38 area. Thus, the Sterling was located near a three-month trend-line circa 1.3760 by Friday morning.
Even if some downward pressure prevailed in the market, it is not likely that this line is breached. In terms of upside potential, bulls should cap their gains near the massive resistance at 1.3860.
Fundamentals from both the US and the UK could introduce some volatility in the market, thus altering the steady pace apparent in the Asian session.
EUR/USD Analysis: Quiet After Fundamentals
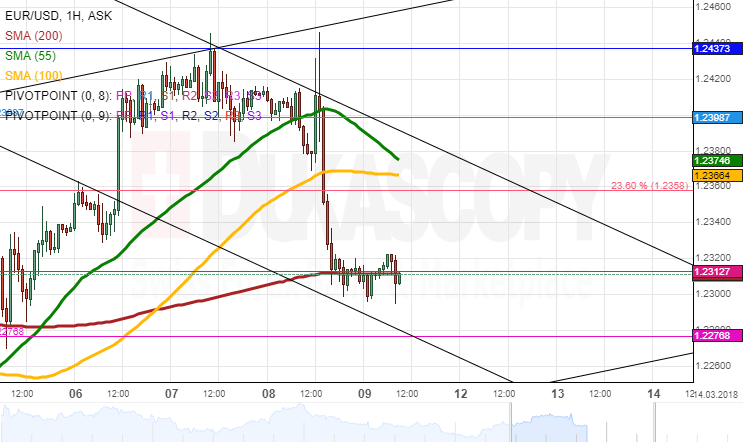
The Euro was trading sideways during the first part of Thursday. A significant volatility was introduced by the ECB mid-session. The Euro initialy strengthened against its American counterpart following the release of the bank's written statement, but plunged 100 pips within a couple of hours in response to Draghi's more cautious tone during the press conference.
The rate once again normalised later in the evening and early today, as a fall below the 1.2340 mark was restricted by the 200-hour SMA and the monthly PP.
Technical indicators being located in the strongly bearish area suggest that the pair should be tended north in this session, thus approaching a resistance cluster formed by the 55– and 100-hour SMAs circa 1.2380. Meanwhile, the rate should not exceed the 38.20% Fibo at 1.2235.
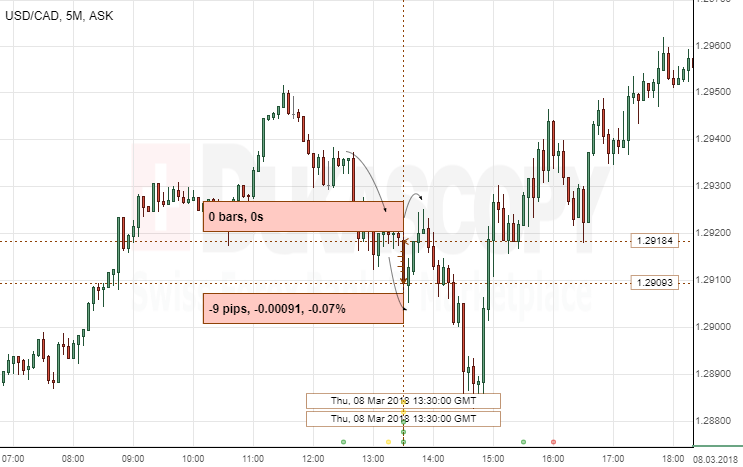
USD/CAD: Canadian Building Permits
The Loonie strengthened against the Greenback, following the release of the canadian building permits report. The USD/CAD currency pair lost nine base points, or 0.07%, reaching the 1,2909 level, to continue fluctuating in the 1.2915 area.
Statistics Canada on Thursday revealed better-then-expected results of monthly canadian building Ppermits for January. The number of housing permits rose by 5.6%, compared to downwardly-revised 2.5% in the prior month. The data surpassed the forecast; in fact, it was the biggest growth in the eight-month period since the 12.9% jump in May 2017. One of the main reasons for this growth was the fact that permits for multi-family housing surged 71% in Toronto, Canada's largest city.
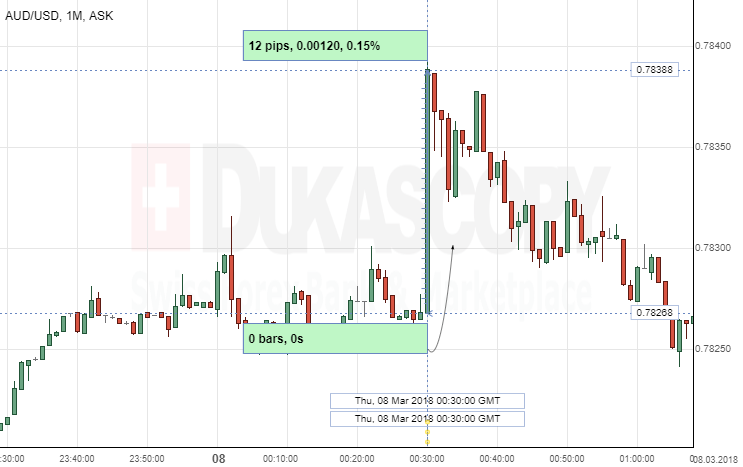
AUD/USD: Australian Trade Balance
The Australian Dollar strengthened against its American counterpart, following the release of the Australian trade balance report. The AUD/USD currency pair gained 12 base points, or 0.15%, reaching the intraday's high of 0.7838. But soon after, the pair was seen coming back to the 0.7826 area.
The Australian Bureau of Statistics revealed on Thursday that January Australian trade surplus was much larger than expected. Instead of the forecasted 0.21B surplus, Australia's seasonally adjusted trade balance increased to 1.06B, compared to a deficit of –1.15B recorded in the prior month. One of the reasons for the better-then-expected data was a sharp decline in imports.
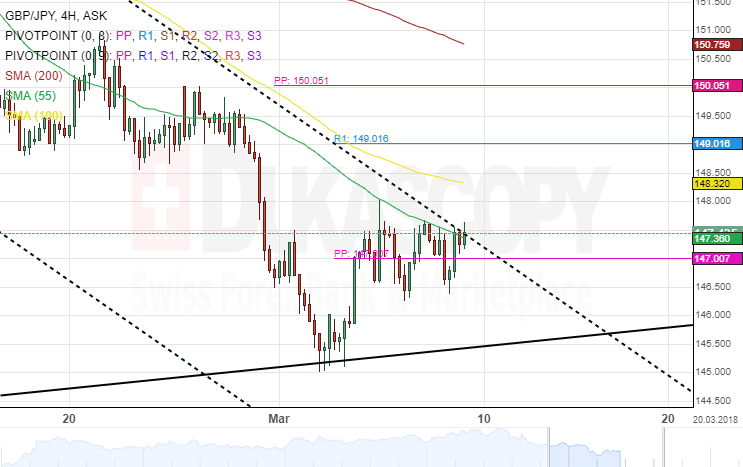
GBP/JPY 4H Chart: Breached The SMA
The Pound Sterling has been trading in a descending channel against the Japanese Yen since early February. After hitting the upper boundary of a junior channel on February 2, the exchange rate started to decline notably during the past few weeks.
The currency exchange rate continues to maintain its channel down, however, the pair has moved closer to the up border and could be set for a breakout from the 55-hour simple moving average.
Technical indicators favour bulls to grow stronger during the next trading sessions.
UK Industrial production 1.3%, 1.6% yoy; Manufacturing production 0.1% mom, 2.7% yoy
European session data update:
UK visible trade balance (GBP) Jan: -12.3b vs exp -12.0b vs prior -13.6b
UK industrial production Jan: 1.3% mom vs exp 1.5% mom vs prior -1.3% mom
UK industrial production Jan: 1.6% yoy vs exp 1.8% yoy vs prior 0.0% yoy
UK manufacturing production Jan: 0.1% mom vs exp 0.2% mom vs prior 0.3% mom
UK manufacturing production Jan: 2.7% yoy vs exp 2.8% yoy vs prior 1.5% yoy
UK construction output Jan: -3/4% mom vs exp -0.5% mom vs prior 1.6% mom
German trade balance Jan: 21.3b vs exp 21.1b vs prior 2.14b
German industrial production -0.1% mom vs exp 0.6% mom vs prior -0.6% mom
Dollar pares some gain as traders turn cautious ahead NFP. AUD, NZD, CAD are the strongest ones. JPY and GBP the weakest.
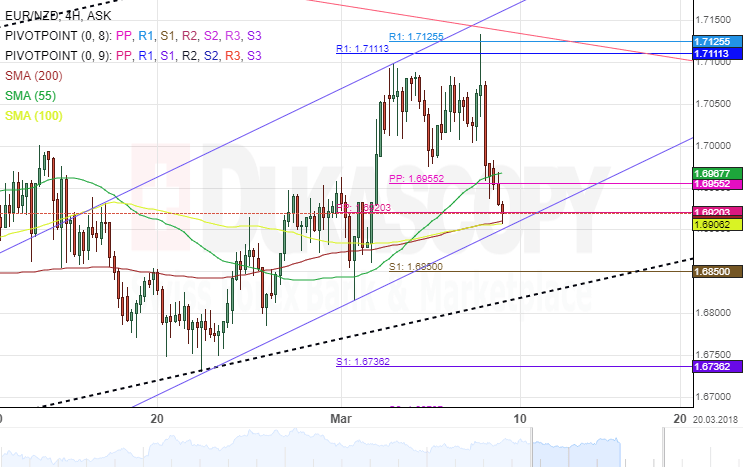
EUR/NZD 4H Chart: Stranded Between SMAs
A full review was made for the EUR/NZD pair, due to previously drawn pattern being broken. The currency pair was moving north until it was stopped by a resistance cluster set by the weekly and monthly pivot points near the 1.7125 area.
A new junior pattern has been mapped to monitor the price movement. At the time of this analysis, the exchange rate was stranded between SMAs. The 55– hour simple moving average was pressuring the pair south while the 100– and 200– hour SMAs at 1.6906 supported the rate.
Everything being equal, it is likely that the Euro could be moving downward to test the lower boundary of a medium-term ascending channel.
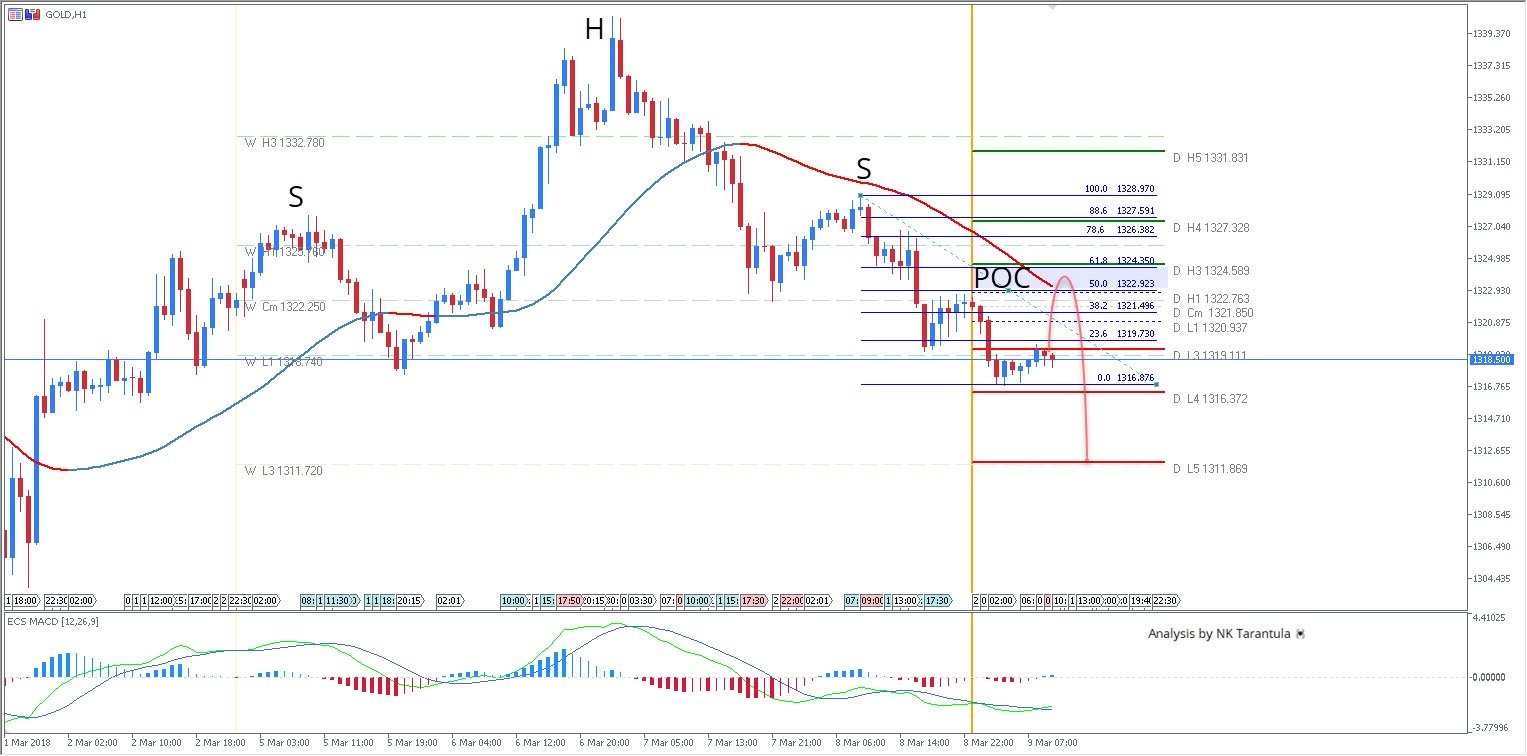
GOLD Has Formed Huge Head And Shoulders Pattern
Gold has formed a giant head and shoulders pattern after the price failed to reach W H4 resistance. At this point, we see that the price is contained below D H3. If it doesn't retrace towards the POC, then watch for a rejection towards D L4 and D L5. Retracement into the POC zone 1322-24 should reject the price, and we might see a retest of 1319 with 1311 as the final target.
W H3 -Weekly Camarilla Pivot (Weekly Interim Resistance)
W L3 - Weekly Camarilla Pivot (Weekly Interim Support)
W H3 - Weekly Camarilla Pivot (Weekly Interim Resistance)
W H4 - Weekly Camarilla Pivot (Strong Weekly Resistance)
D H4 - Daily Camarilla Pivot (Very Strong Daily Resistance)
D L3 – Daily Camarilla Pivot (Daily Support)
D L4 – Daily H4 Camarilla (Very Strong Daily Support)
POC - Point Of Confluence (The zone where we expect price to react aka entry zone)
Daily Wave Analysis: EUR/USD Breaks Support Line Via Wave ABC Pattern
Currency pair EUR/USD
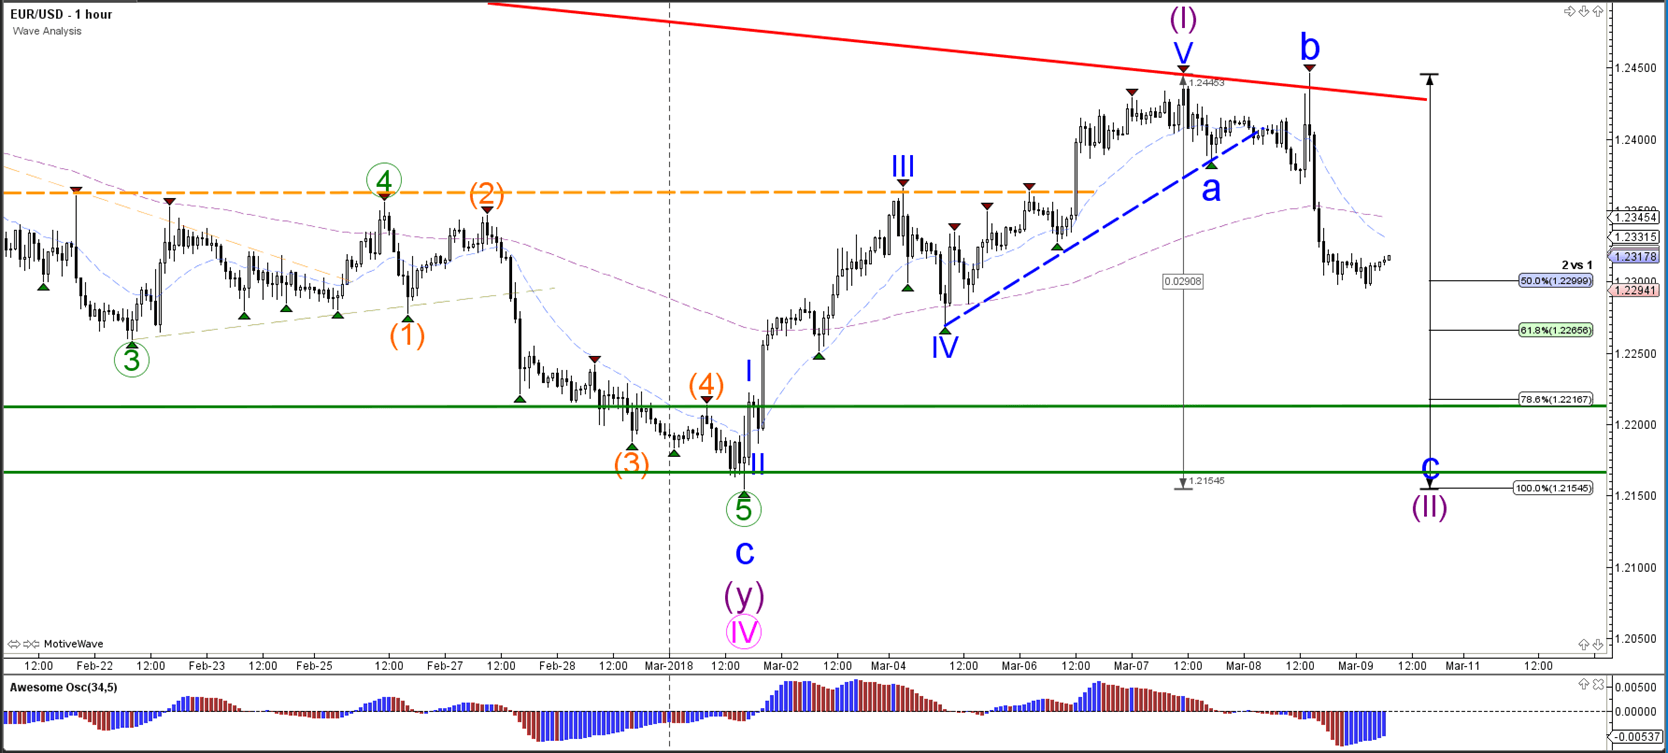
The EUR/USD made a bearish retracement as expected in yesterday’s analysis named “EUR/USD Prepares for ABC Zigzag in Bearish Wave 2”. A bullish breakout above resistance (red) could start the wave 5 (pink) whereas a break below support makes a downtrend more likely.
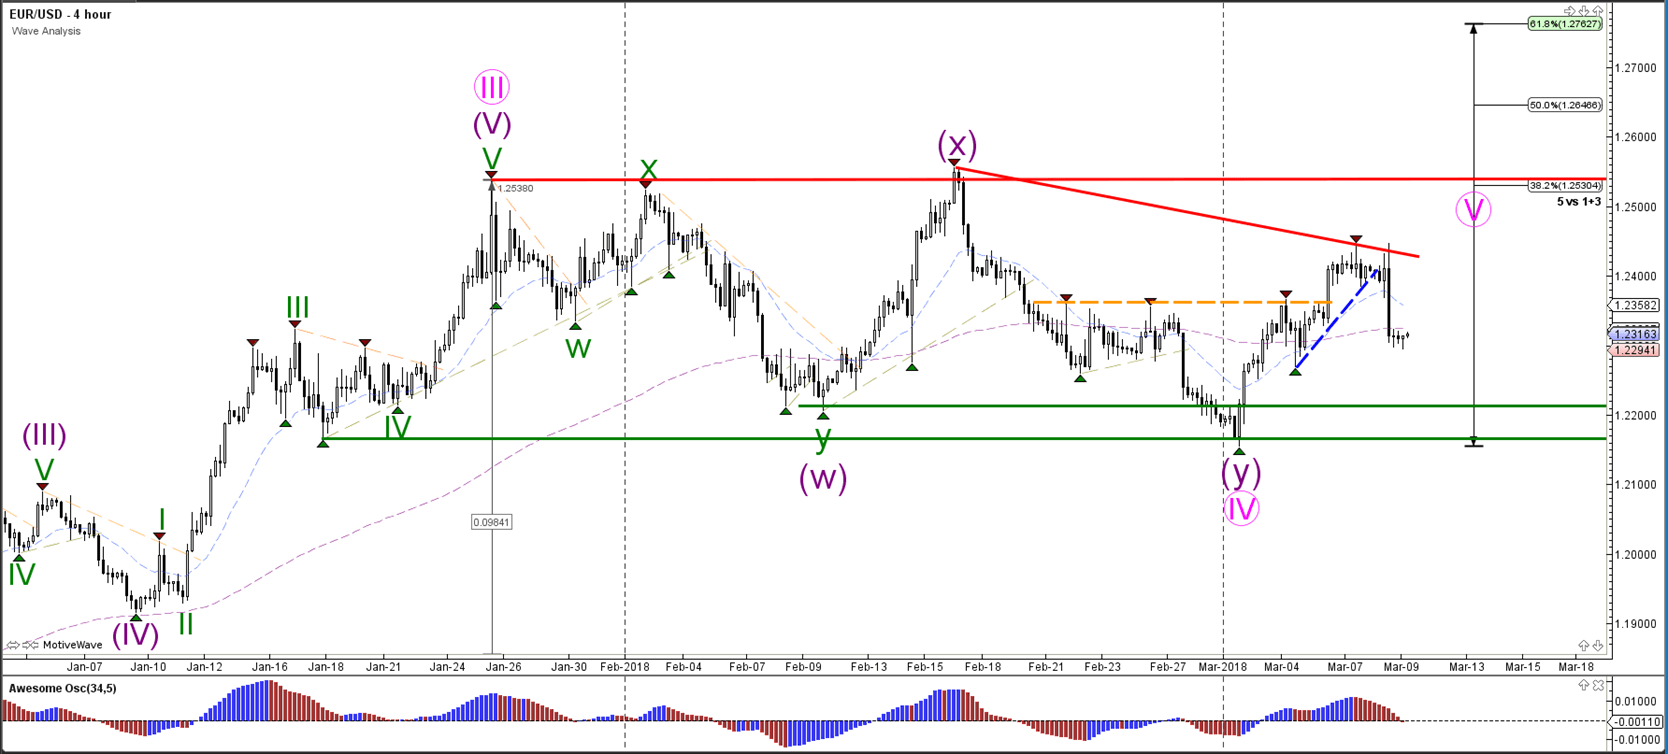
The EUR/USD is indeed building a bearish correction after completing 5 bullish waves (blue). The bearishness is probably an ABC zigzag (blue) within wave 2 (purple).
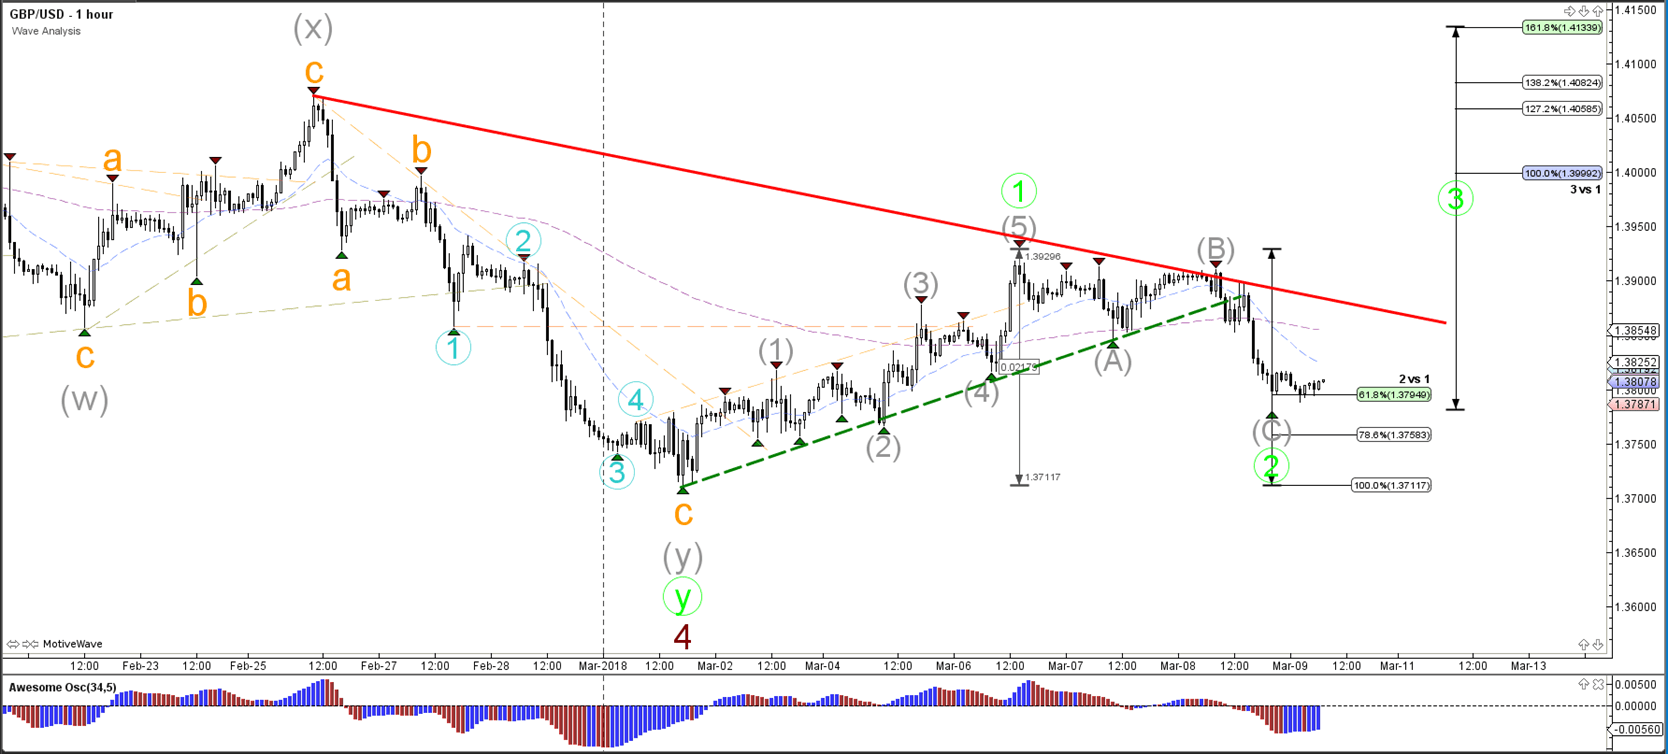
Currency pair GBP/USD
Also the GBP/USD is probably creating a wave 1-2 (green) unless price breaks below the bottom of wave 4 (brown). A bullish break above resistance (red) could confirm wave 5 (brown).
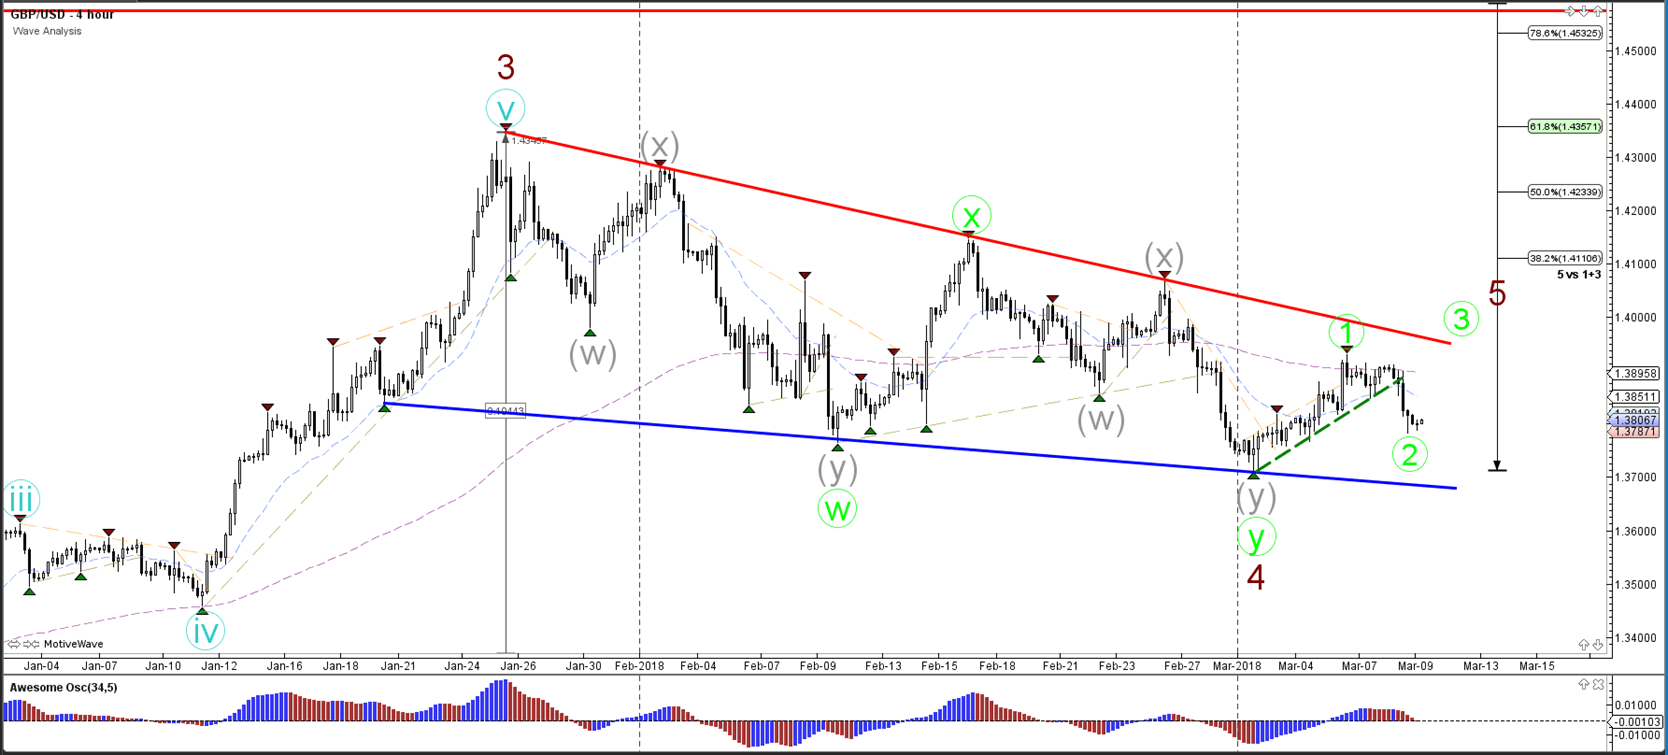
The GBP/USD is probably building a bearish correction after completing 5 bullish waves (grey). The bearishness is probably an ABC zigzag (grey) within wave 2 (green).
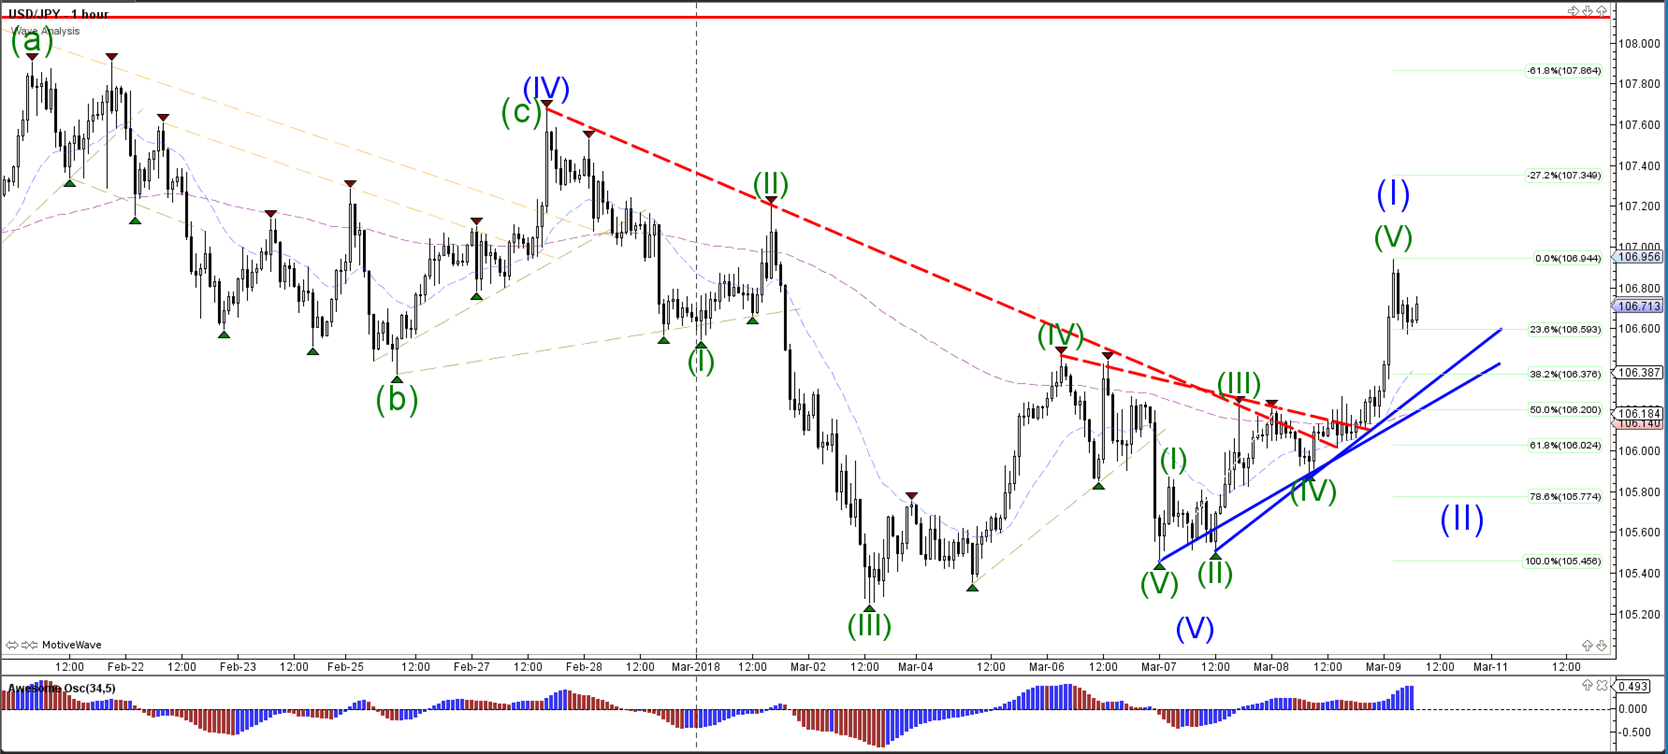
Currency pair USD/JPY
The USD/JPY broke above the resistance trend line (dotted red) and could be building a bullish breakout.
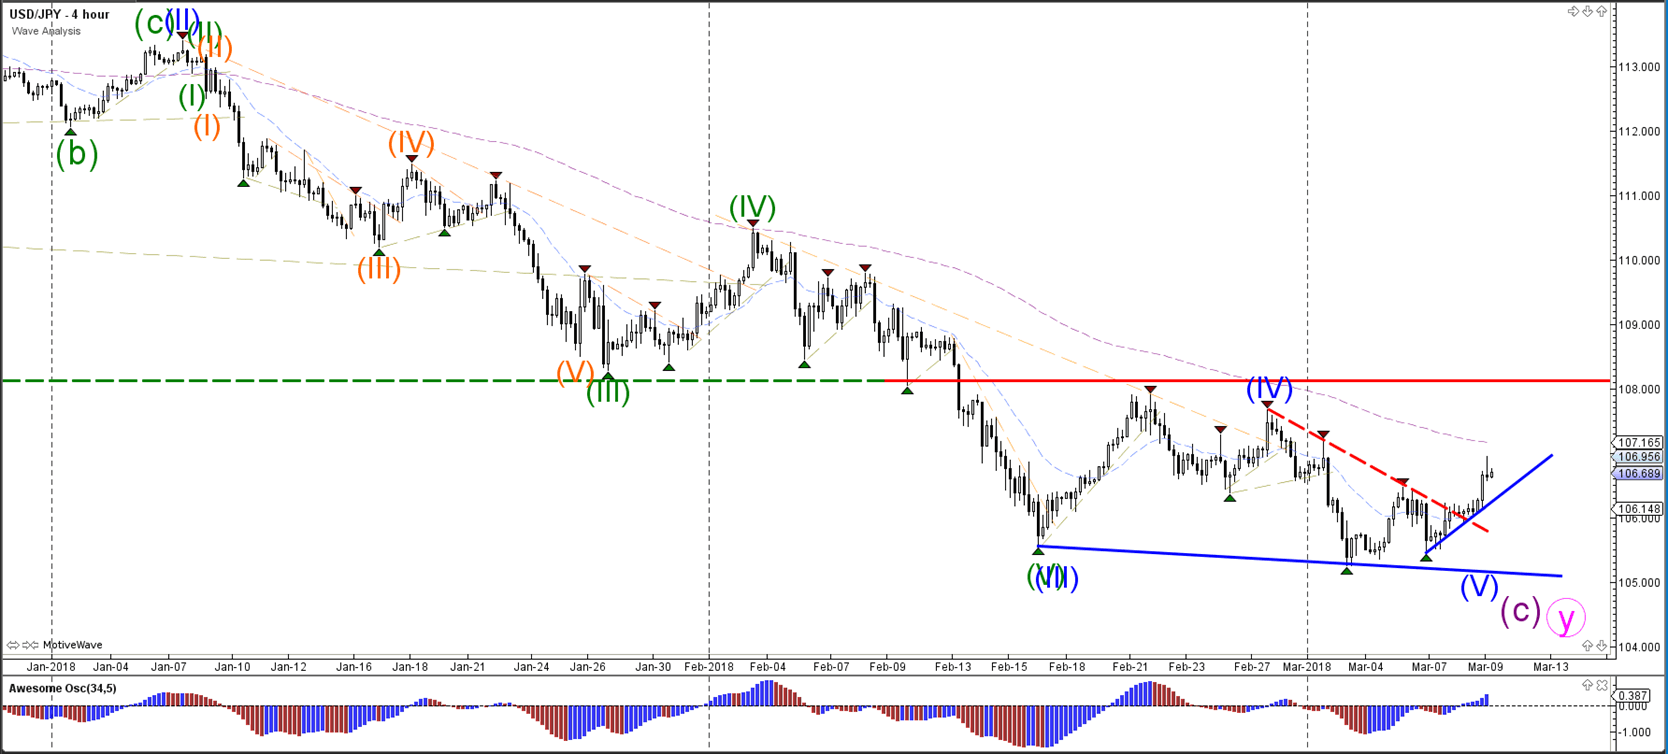
The USD/JPY breakout is a potential wave 1 (blue) and any retracement could find support at the Fib levels of wave 2 (blue).