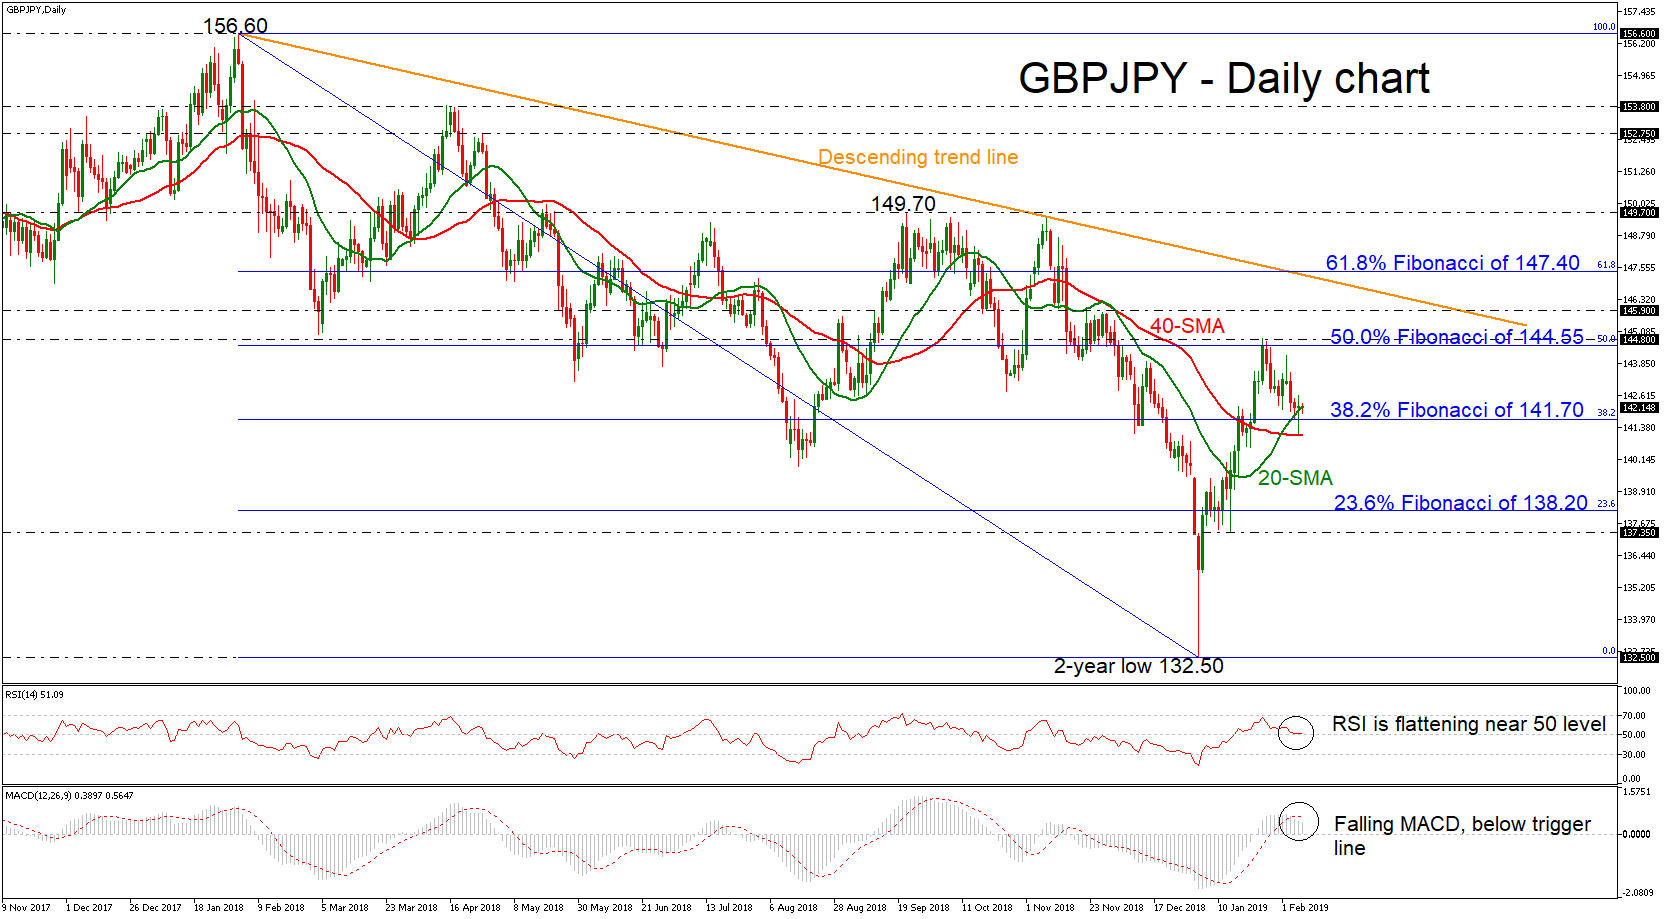
GBPJPY has rebounded somewhat on the 40-day simple moving average (SMA), which posted a bullish crossover with the 20-day SMA. Also, the price surpassed the 38.2% Fibonacci retracement level of the downleg from 156.60 to the more than two-year low of 132.50, around 141.70.
Despite the bullish cross of the SMAs, the technical indicators continue to slow down, mirroring the market’s bearish to neutral behavior over the past couple of days. The RSI indicator is still moving in bullish territory but is flattening, while the MACD oscillator slipped beneath the trigger line, which support the bearish view in the short term as well.
In case the pair drops back below the 38.2% Fibonacci and the 40-day SMA, the bears will probably challenge the 23.6% Fibonacci region around 138.20. A break lower, could last until the 137.35 support, taken from the bottom on January 15.
Alternatively, a recovery to the upside could open the way towards the 50.0% Fibonacci of 144.55 and the 144.80 resistance zone, identified by the peaks on January 25. Above the latter, the 145.90 resistance could act as significant obstacle for investors before touching the long-term descending trend line.
Overall, the long-term structure remains strongly negative over the last year and only a jump above the downtrend line would change the outlook to a more bullish one.