

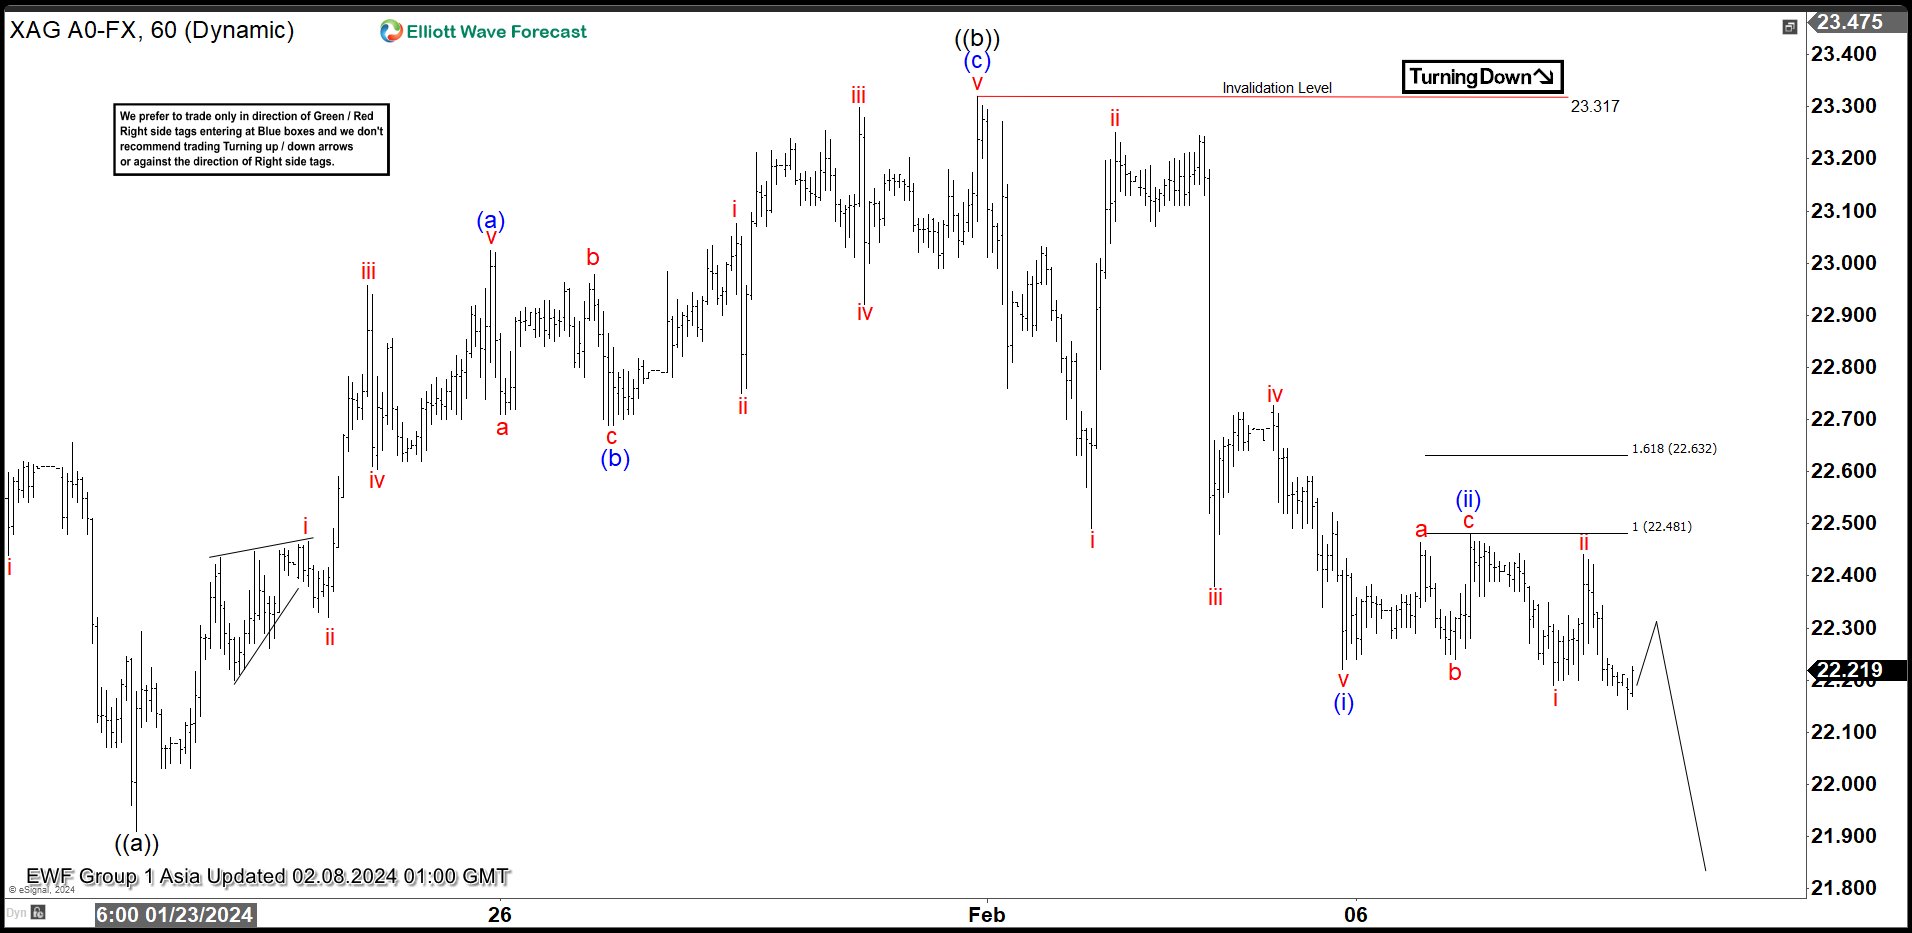
Short Term Elliott Wave view in Silver (XAGUSD) suggests that the metal has traded sideways since the low in August 2022. The short term 1 hour chart below shows the move down from 12.4.2023 high which takes the form of a double three Elliott Wave structure. Down from 12.4.2023 high, wave W ended at 22.49 and rally in wave X ended at 24.6. Wave Y lower is in progress as a zigzag structure. Down from wave X, wave ((a)) ended at 21.91 as the 1 hour chart below shows. Up from there, wave (a) ended at 23.02 and pullback in wave (b) ended at 22.68. Wave (c) lower ended at 23.31 which completed wave ((b)) corrective rally.
Wave ((c)) lower is in progress as a 5 waves impulse Elliott Wave structure. Down from wave ((b)), wave (i) ended at 22.22 and rally in wave (ii) ended at 22.48. The metal then extended lower in wave (iii). Near term, as far as pivot at 23.3 high stays intact, expect rally to fail in 3, 7, 11 swing and the metal to extend lower. Potential target lower is 100% – 161.8% Fibonacci extension from 12.4.2023 high. This area comes at 19.1 – 21.2 where buyers can appear for further upside or 3 waves rally at least.
XAGUSD 60 Minutes Elliott Wave Chart
Silver (XAGUSD) Elliott Wave Video


By loading the video, you agree to YouTube’s privacy policy.
Learn more

 Technical: Medium-Term Up Trend Remains Intact, Start of New Bullish Impulsive Leg")
 Technical Outlook: Mixed Signals as Rate Cut Expectations Grow")
 Targets $40.3 in Wave 5 Rally")
: Silver Holds Firm Above $37.00 on Weak Jobs Data, Rate Cut Bets and Confirmed Reciprocal Tariffs")


%20suggests%20that%20the%20metal%20has%20traded%20sideways%20since%20the%20low%20in%20August%202022.%20The%20short%20term%201%20hour%20chart%20below%20shows%20the%20move%20down%20from%2012.4.2023%20high%20which%20takes%20the%20form%20of%20a%20double%20three%20Elliott%20Wave%20structure.%20Down%20from%2012.4.2023%20high,%20wave%20W%20ended%20at%2022.49%20and%20rally%20in%20wave%20X%20ended%20at%2024.6.%20Wave%20Y%20lower%20is%20in%20progress%20as%20a%20zigzag%20structure.%20Down%20from%20wave%20X,%20wave%20((a))%20ended%20at%2021.91%20as%20the%201%20hour%20chart%20below%20shows.%20Up%20from%20there,%20wave%20(a)%20ended%20at%2023.02%20and%20pullback%20in%20wave%20(b)%20ended%20at%2022.68.%20Wave%20(c)%20lower%20ended%20at%2023.31%20which%20completed%20wave%20((b))%20corrective%20rally.)