

Key Highlights
- Gold prices started a fresh decline from the $2,060 resistance.
- It traded below a key bullish trend line with support at $2,025 on the 4-hour chart.
- EUR/USD is consolidating losses below the 1.0830 resistance.
- The US Consumer Price Index could decline to 2.9% in Jan 2023 (YoY).
Gold Price Technical Analysis
Gold failed to settle above the $2,060 resistance zone against the US Dollar. It started a fresh decline below the $2,050 and $2,040 levels.
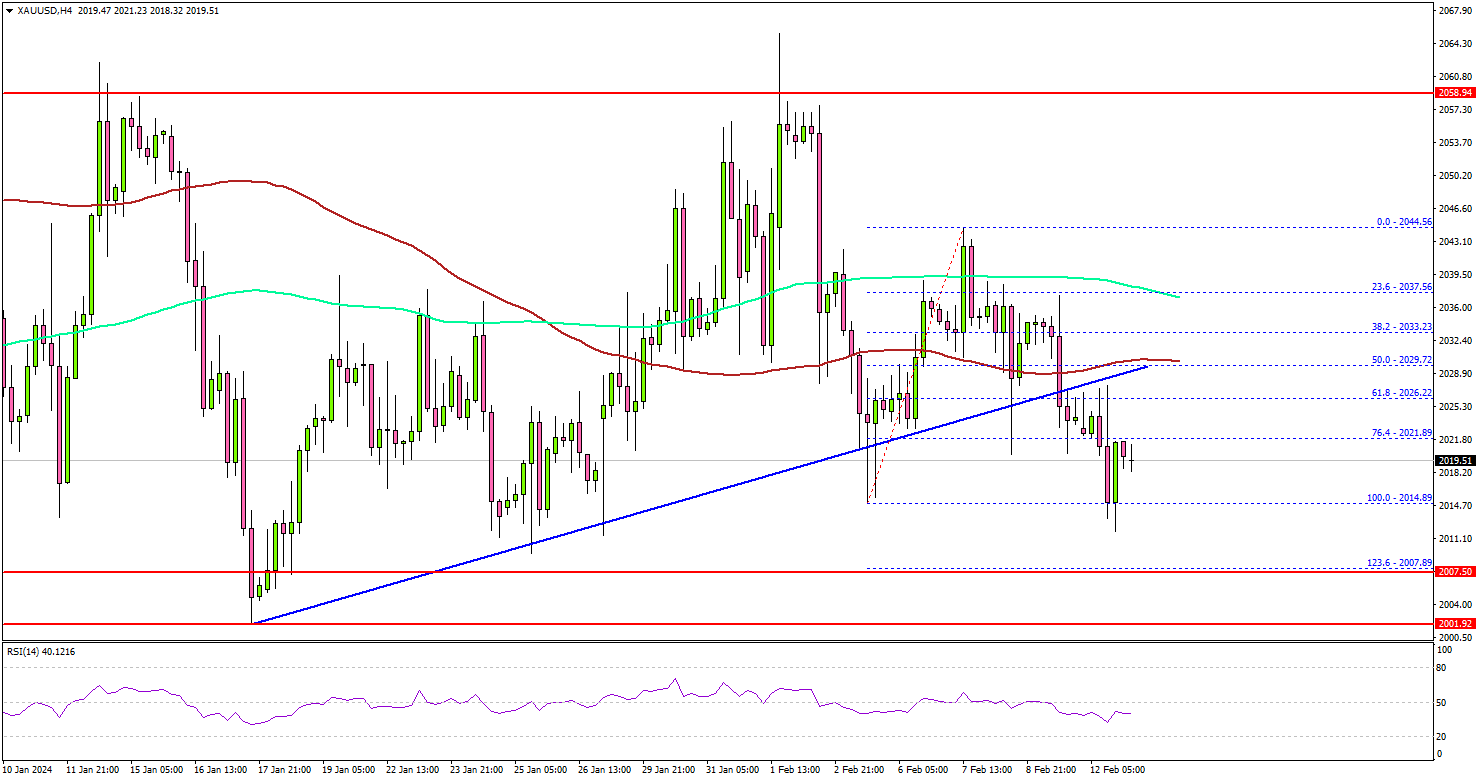
The 4-hour chart of XAU/USD indicates that the price settled below the $2,030 level, the 100 Simple Moving Average (red, 4 hours), and the 200 Simple Moving Average (green, 4 hours).
Besides, Gold traded below a key bullish trend line with support at $2,025 on the same chart. The current price action suggests a high chance of more downsides below the $2,010 level. Initial support is near the $2,007 level.
The first major support sits at $2,000. Any more losses might call for a move toward the $1,975 level in the coming days.
On the upside, the price is facing hurdles near the $2,030 level and the 100 Simple Moving Average (red, 4 hours). An upside break above the $2,030 level could send the price soaring toward the $2,050 resistance. The next major resistance is near the $2,060 level, above which Gold could test $2,078.
Looking at EUR/USD, the pair is still trading in a bearish zone below 1.0830 and there could be more losses in the near term.
Economic Releases to Watch Today
- US Consumer Price Index for Jan 2023 (MoM) – Forecast +0.2%, versus +0.2% previous.
- US Consumer Price Index for Jan 2023 (YoY) – Forecast +2.9%, versus +3.4% previous.
- US Consumer Price Index Ex Food & Energy for Jan 2023 (YoY) – Forecast +3.7%, versus +3.9% previous.


 and Silver (XAG) Send Mixed Signals to Doubtful Traders")
 Price Technical Outlook: $4000/oz Holds Firm as FOMC Minutes and Labor Data Releases Lie Ahead")

: 9% Dead Cat Bounce Rally at Risk of Reversal, Watch US$4,036 Downside Trigger")

