
A trend, on the Forex market, is a dominant direction of price movement. For example, if the price is rising, then the trend is ascending — and vice versa. The ability to determine trends at their very beginning is the main quality that differentiates a successful trader from an amateur.
There are quite a lot of methods for trend identification — from the casual visual inspection and to specialised custom indicators. This article will review the most interesting and usable ones.
Visual Analysis
Visual analysis is the most simplistic ways to determine a trend. All you need is a chart and your eyes — even one will do. To identify a trend visually:
- Spot the highs on the segment of the chart you analyzing;
- Spot the bottoms on the segment of the chart you are analyzing;
- Draw one line through the highs, the other through the bottoms.
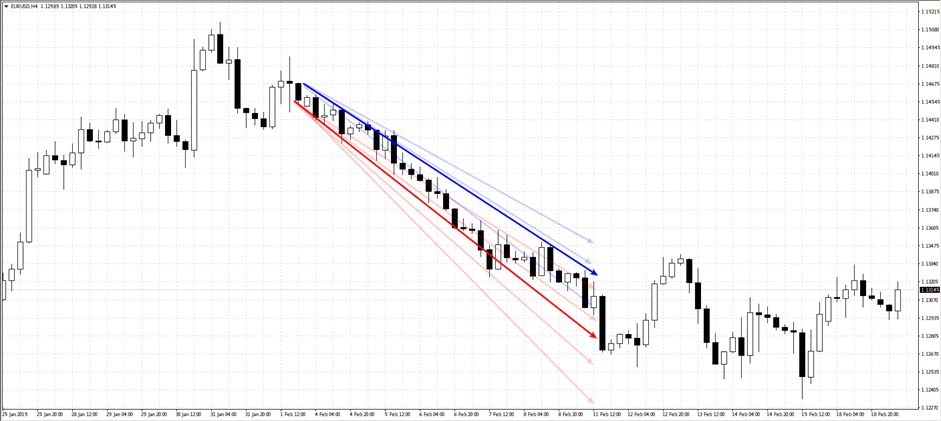
Transparent lines show trends at different timeframes, opaque lines indicate their average values.
The direction of those lines would be the trend. If both lines are moving up — the market is experiencing an upward trend. If both are moving down — downward trend. If lines are moving away from each other — the market is ranging. If the lines are moving sideways — the market is flat.
The problem with a visual analysis is the sample size. You need the trend to be going for a while in order to identify it visually, and this deprives you of a lot of profits you’d get if you saw it early. That’s why professional traders are using indicators to identify trends.
Moving Averages
Moving averages represent the average cost of the asset throughout the certain number of candlesticks. For example, the popular 50 MA indicator shows the average value of the last 50 daily candlesticks.
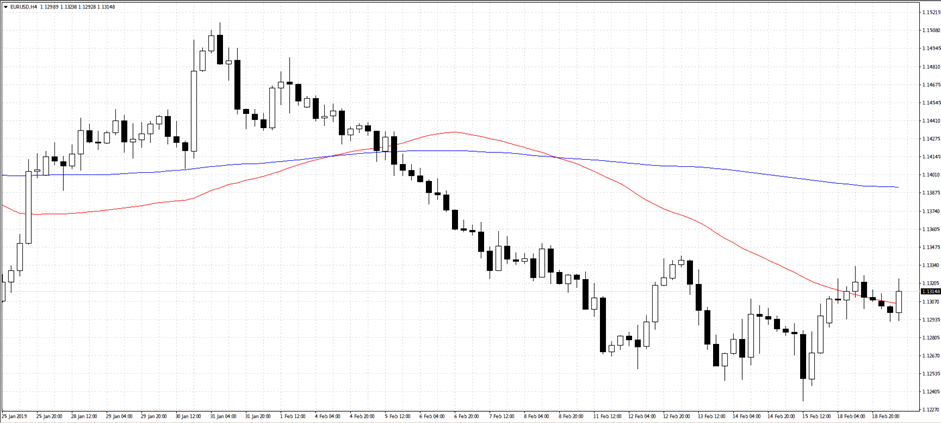
The red line represents the 50 MA, the blue line represents the 200 MA. Those averages are the most influential on the market.
Moving averages are easy to use. When the price goes above the moving average, the trend is ascending. When the price is below the moving average, the trend is descending.
MACD
Identifying trends by moving averages is a good option, but there are ways to make it even simpler and more precise. MACD (Moving Averages Convergence/Divergence indicator) shows you the difference between 200 MA and 50 MA — two most influential moving averages on the market.
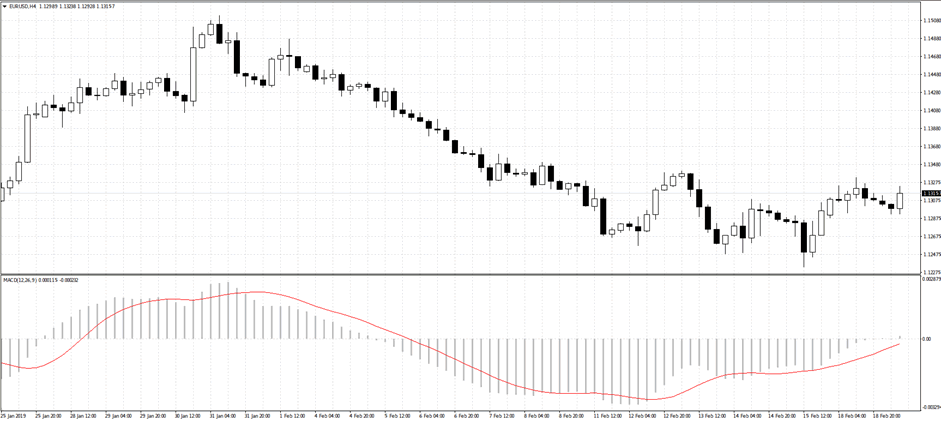
Compare the MACD indication with the moving averages from the previous picture.
Once the point 0 is crossed, MACD indicates the beginning of a new trend. If the trend moves towards the positive sector, the trend is ascending. If it moves towards the negative sector, the trend is descending.
Originally MACD did not differentiate between weak and strong trends but the modern versions of the indicator have signal lines — sectors which indicate prevalent trends. Inexperienced traders should use only those trends that reach the signal lines since they offer much more reliable performance.
Momentum
The Momentum indicator is a little unconventional when it comes to identifying trends. It measures the rate at which the price changes, which often precedes the beginning of a new trend.
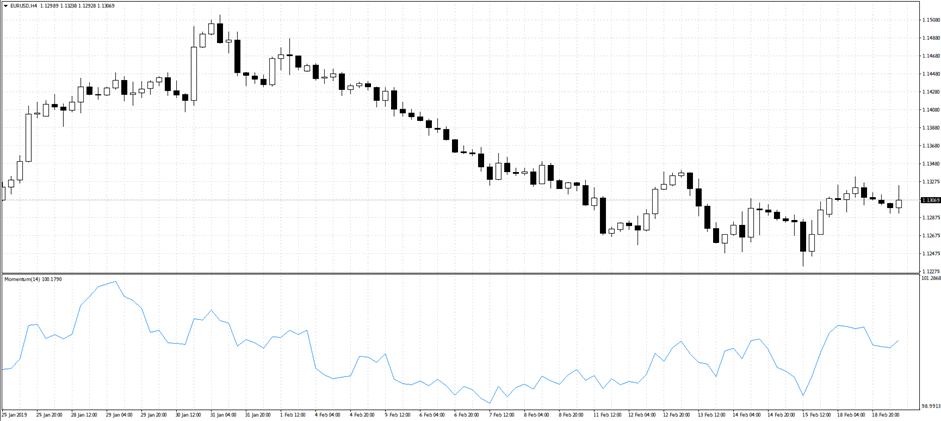
The Momentum indicator corresponds pretty well to the trends but is less precise than the other indicators.
Momentum is an auxiliary indicator, and not it’s not very useful if you can already identify trends visually.
Conclusion
With custom indicators, identifying the trends on Forex is easier than ever. However, if you want to try trend-trailing, you need a reliable broker with fast and reliable order processing. If you haven’t got one yet — check out JustForex. They’ve got a decent educational program, responsive support, and low spreads. And, most importantly, they will double your deposit, as long as it is more than 10 USD.


