
U.S. Highlights
- As widely expected, the Fed hiked rates once more this year. At the same time, the Fed’s dot plot moved lower over the forecast horizon. These changes are consistent with a softer inflation and economic outlook.
- Data came in broadly positive, with housing starts and home resales both defying weaker market expectations. Consumer spending remained hot in November, with consumption looking set to advance by a sturdy 4% (annualized) in Q4.
- The late-year equity market sell off continued this week, with looming risks for a partial government shutdown marking the latest in a series of factors that are likely to weigh on sentiment through the New Year.
Canadian Highlights
- Christmas came early for economic data watchers this week. A slew of reports showed both the strengths and weaknesses of Canada’s economy.
- On the weak side, existing home sales pulled back 2.3% in November, falling for a third straight month. Still, the housing market appears to be stabilizing at this lower level with sales to new listings in balanced market territory and quality adjusted prices up 2% from a year ago.
- On the stronger side, GDP expanded by 0.3% in October. Businesses remain relatively optimistic about the future and note ongoing capacity constraints, which should show up in stronger investment in non-oil-related sectors.
U.S. – Fed Set To Walk On Data Talk
It was a busy data week, but the FOMC meeting was the main event. As widely expected, the Fed hiked rates for the fourth time this year, lifting the upper bound of the fed funds rate to 2.5%. More interesting was that the Fed’s dot plot, which shows members’ expectations for future rate increases, shifted lower in 2019. The median expectation is now for two hikes, down from three previously. The expectation for the longer-run level of the fed funds rate also moved down 25 basis points to 2.75%. Consistent with these changes are a slightly more subdued price outlook and slightly higher unemployment rate, both a sign of a softer economic outlook in the years ahead.
The Fed’s dovish tone with respect to future hikes did little to appease investors. Both U.S. and international equity markets extended their losing streak on the news. It should be noted, however, that the path of interest rates is not set in stone, with the Fed placing a greater emphasis on data-dependency. As Fed Chair Powell put it, from this point on “we’re going to be letting the data speak to us”.
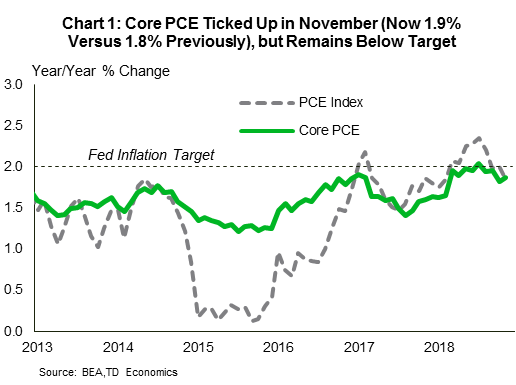
Speaking of data, this week’s releases continued to confirm several running themes. First, inflation remains near target but has softened lately. The core PCE prince index, the Fed’s preferred measure of inflation, edged up in November, but still fell short of target (Chart 1). Secondly, U.S. consumer spending remains hot. Real spending was up 0.3% in November. With two months in the bag, consumption looks set to advance by close to 4% (annualized) in the final quarter of the year, better than previously expected. This brings our tracking for real GDP for the same quarter up to 2.8% – a deceleration from the third quarter (3.4%), but enough to keep growth at 2.9% for the year.
Third, the housing market remains soft but recent improvements are encouraging. Both housing starts (3.2%) and existing home sales (1.9%) rose in November, besting market expectations. On a less positive note, starts were propped up by the volatile multifamily segment (single-family starts fell for a third straight month), while home resales are still down between 3% and 15% year-on-year across major U.S. regions.
As the sugar high from monetary and fiscal stimulus wears off, we expect growth to slow to a still-healthy 2.5% in 2019. But, several potential potholes lie in the path ahead (see here). The latest spending bill impasse, which could lead to a partial government shutdown, is but one example. Given that shutdowns typically prove to be short-lived, history suggests limited economic impact. However, the hit to market confidence could prove more damaging.
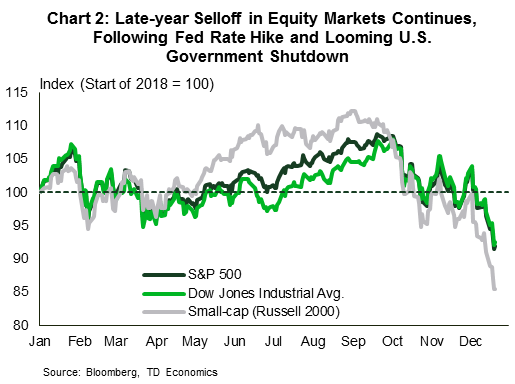
Given expectations for slowing growth and the pronounced late-year selloff in equity markets (Chart 2), the “recession” word has gained traction recently. Our recent look at a broad range of indicators points sees little evidence for this in the economic data. That said, negative expectations have the potential to become self-fulfilling. But for now, the only thing we have to fear is fear itself.
Canada – A Solid Year In Spite Of Headwinds
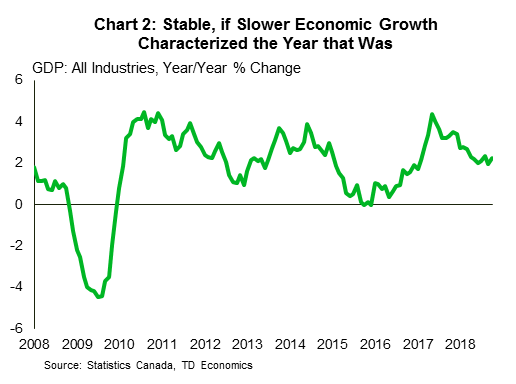
As the year draws to a close, it’s a good time to look back on what was. 2018 was a year of adjustment for the Canadian economy. From new mortgage regulations to trade uncertainty and plummeting oil prices, it was also a year of headwinds. Economic growth downshifted from a lofty 2.9% in 2017 to a still-respectable 2.1% in 2018. Underneath the headline, the drivers also shifted. After years of supporting growth, residential investment subtracted from it in 2018. Fortunately, its negative contribution was offset by a reversal in the contribution from net exports, something we expect to continue over the next year.
The data flow this week echoed these themes. Canadian home sales continued their descent in November, falling 2.3% – a third straight monthly drop. Importantly, the drop in sales was met with fewer listings, leaving the housing market in balanced market territory. Adjusted for quality, home prices across the country were up 2.0% from a year ago. The market appears to be showing signs of stabilization, but at a lower level of activity than the heady pace of the past several years.
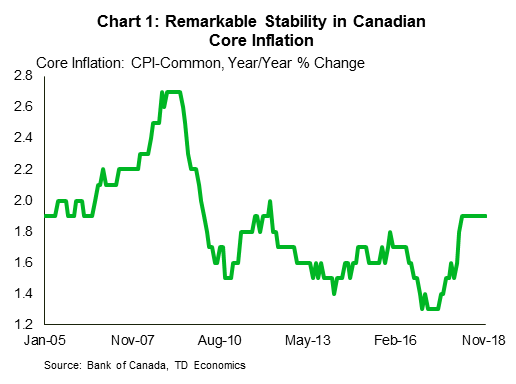
Stable is also the word to describe Canada’s inflation backdrop. While headline consumer price growth decelerated to 1.7% in November due to falling oil prices, the Bank of Canada’s core measures have been remarkably steady, hovering in a narrow range between 1.8% and 2.1% over the course of the year. In November, the CPI-common measure marked its 10th month at 1.9%), its longest string of steady growth on record (see Chart 1).
The impact of lower oil prices is likely to be felt more noticeably in Canadian economic data over the remainder of 2018, but the fourth quarter at least started off on a strong foot, with GDP growing by 0.3% m/m in October. Encouragingly, growth was widespread across a majority of both goods and services-producing industries, with the notable exception of construction, which pulled back for a fifth straight month. Even with the strong start to the quarter, growth is likely to average just 1.7% in Q4. November saw the worst of the discounts on Canadian oil blends, and voluntary production curtailments are likely to weigh on activity (see our report). This will sap year-end growth, even before mandatory production cuts come into effect in January.
The year also had its mysteries, answers to which may be forthcoming over the next year. The first is that in spite of solid investment intentions and capacity pressures, actual business investment has remained soft. Non-residential business investment in the third quarter of 2018 was more or less where it ended 2017. We look for acceleration in investment in 2019, but the uncertainty around the sector must be acknowledged in light of this year’s developments. The second is that despite a record-low unemployment rate and vacancy rates at record highs, wage growth has remained subdued. Surveys suggest that businesses facing vacancies will offer juicier wages to attract applicants, but we’re still waiting to see this show up in the data.
U.S.: Upcoming Key Economic Releases
U.S. ISM Manufacturing Index – December
Release Date: January 3, 2018
Previous: 59.3
TD Forecast: 57.3
Consensus: 58.4
As suggested by weaker-than-expected prints in both the Empire Manufacturing and Philly Fed surveys, we look for the ISM Manufacturing index to give back some of its recent strength in December. Although we expect it to recede more than current consensus, we note that the ISM index remains at strong levels and well away from contractionary territory. ISM’s employment index should give us confirmation of steady labor demand in the manufacturing sector, while new orders could be atrisk of a pullback after hovering above the strong 60 level for most of the year.

U.S. Employment – December
Release Date: January 4, 2018
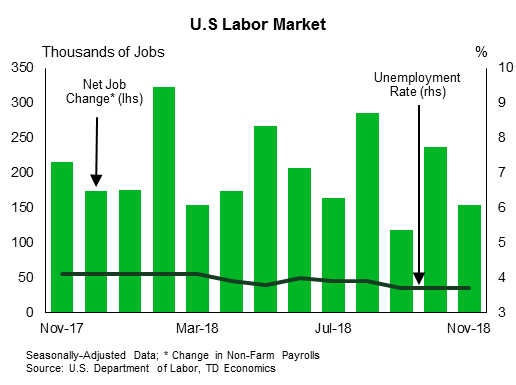
Previous: 155k, unemployment rate: 3.7%
TD Forecast: 190k, unemployment rate: 3.7%
Consensus: 183k, unemployment rate: 3.7%,
TD expects payrolls to rebound to an above-consensus 190k for December following a larger than expected slide to 155k for November. Surveys published so far (Empire, Philly Fed) suggest employment likely remained firm in the manufacturing sector and there could be scope for an upside surprise from employment in the services sector (surveys are yet to be published). The construction sector will be particularly interesting to follow since it could continue to reflect weakness in activity. On the back of this, we anticipate the unemployment rate to stay largely unchanged at 3.7%. Lastly, we anticipate wages to rise 0.3% m/m in December largely reflecting a favourable reference week. This should bring the annual print down slightly to 3.0% from 3.1% in November.
Canada: Upcoming Key Economic Releases
Canadian Employment – December
Release Date: January 4, 2018
Previous: 94k, unemployment rate: 5.6%
TD Forecast: 15k, unemployment rate: 5.6%
Consensus: N/A
TD looks for job growth to slow to 15k in December following the blockbuster 94k increase last month. While the LFS is inherently volatile and has a tendency to mean-revert after such outsized moves, we believe that these gains will be sustained given a large gap between cumulative job growth for 2018 reported in the LFS versus that from payroll (SEPH) data. A 15k increase in net employment will see the unemployment rate hold at the current post-crisis low of 5.6%, although other details should prove more downbeat. We see scope for full time employment to give back some of the 90k jobs created in November, leaving part-time hiring to drive job growth. And while wage growth is forecast to edge higher to 1.6% y/y, this is still quite subdued relative to historical norms especially given the diminished slack in the labour market.


 Minutes of the Federal Open Market Committee")


