
Week beginning 18 March 2019
- Case for RBA rate cuts continues to build.
- RBA: Assistant Governor Financial Markets Kent speaks.
- Australia: AusChamber-Westpac survey, Westpac-MI Leading Index, employment.
- NZ: GDP, consumer confidence, current account.
- UK: Meaningful Vote, BOE policy meeting.
- Europe: EU Summit, consumer confidence.
- US: FOMC policy meeting.
- Flash PMI’s for Japan, the Euro Area and the US.
- Key economic & financial forecasts.
Information contained in this report current as at 15 March 2019.
Case for RBA Rate Cuts Continues to Build
Westpac’s forecast for RBA rate cuts in 2019, set down on February 21, has gained significant support over the last week. Updates on business and consumer confidence show the growth slowdown over the second half of last year is carrying into 2019 and starting to affect decision making. The case for cuts may build further with the release of next week’s labour market data.
Markets are now giving about a 50% chance of an RBA cut by June, up from a 40% chance immediately following the December quarter GDP release. We continue to favour moves coming later in the year – August and November the likeliest timing – with the Bank still seeming reluctant to cut and likely to require more evidence around the ‘consumer-housing nexus’ and the labour market outlook before taking action.
The NAB business survey indicates that both business conditions and business confidence weakened in February – with both at below average levels. The business conditions index fell by 3pts to +4, down sharply from the average +18 read over the first half of 2018. Business confidence also fell by 2pts to +2.
We see the soft business update as a significant development. The February read is less affected by holiday season volatility, and is a clearer confirmation that the sharp loss of economic momentum since mid-2018 has extended into 2019. That is consistent with Westpac’s view of GDP growth running at a below trend 2.2% pace in 2019.
The detail shows particularly weak conditions for retail, the December–February period marking the weakest three month run since 2013, and construction which saw conditions dip into contractionary territory. The state breakdown continues to show a sharp loss of momentum in NSW and Victoria. All of this is consistent with increasing negative spillovers from the Sydney and Melbourne housing corrections.
Importantly, the shift is clearly starting to affect businesses willingness to hire and invest. While the employment component of the survey moved sideways in the February month, at +5 it continues to show a clear easing from the +11 averaged over the first nine months of 2018. Meanwhile, the March survey points to downside risks around investment, with capacity utilisation falling to below average levels and capital expenditure plans down to a three year low.
Consumer confidence is also starting to falter. The Westpac- Melbourne Institute Consumer Sentiment Index fell 4.8% to 98.8 in March from 103.8 in February. The move takes the index back below 100, indicating pessimists again outnumber optimists, in contrast to the ‘cautiously optimistic’ reads that prevailed throughout 2018.
At 98.8, the index is still only ‘cautiously pessimistic’ and comfortably above the average level recorded in 2017. However, the March fall looks likely to be sustained with the survey detail indicating the poorer run of economic news is starting to weigh more heavily. Indeed, responses collected after the March 6 GDP release were much weaker, consistent with an Index level of 92.7. We suspect that the national accounts release clarified what were previously somewhat mixed signals about the extent of Australia’s growth slowdown. As such this aspect of the March weakening in consumer sentiment looks likely to be sustained.
Other aspects of the March consumer sentiment survey also suggest the shift is starting to have a bearing on decisions.
Job loss concerns rose sharply in the month, the Westpac- Melbourne Institute Unemployment Expectations Index recorded an 8.9% jump, indicating more consumers expect unemployment to rise in the year ahead.
Responses to additional questions on the ‘wisest place for savings’ also show risk aversion rising to extremely elevated levels. Two thirds of consumers favouring safe options – bank deposits, superannuation or paying down debt – and just 17% nominating risky options such as real estate and shares. The mix is more risk averse than at the height of the global financial crisis.
Both job loss concerns and rising risk aversion raise the risk of a further move by households to rein in spending and increase savings, all of which would be consistent with Westpac’s expectation of a significant ‘wealth effect’ drag on demand.
The labour market is the main focus domestically over the coming week with the February labour force survey to be released on March 21. Leading indicators have softened in recent months and we are expecting next week’s update to be softer with employment dipping 5k and the unemployment rate nudging up to 5.1%.
However, this is within the range of monthly volatility for the labour force survey. A clearer moderating trend is only likely to emerge through March–April–May, as the slower growth pulse combines with businesses putting hiring on hold around the Federal election (a feature of the two previous elections in 2016 and 2013).
The Reserve Bank Board next meets on April 2. While Westpac expects the RBA to cut the cash rate by 50bps by the end of 2019, we do not expect the Bank to move rates at its April meeting. The weak December quarter national accounts will undoubtedly prompt a further downward revision to the RBA’s growth forecasts to be released in the next Statement on Monetary Policy on May 10. However, this is unlikely to shift its views on the labour market – an area of strength that the Bank has highlighted as key to its policy considerations – by enough to warrant a policy easing.
The Federal Budget, due on the same day as the April RBA Board meeting, adds another layer of uncertainty. With the government’s budget position improving, boosted in part by recent gains in commodity prices, and an election looming in May, there is certain to be significant stimulus measures tabled. That said, whether these will be sufficient or credible enough to turn the dial on confidence and the wider economy in a timely manner is unclear. Fiscal policy still looks to be constrained by the perceived need of both political parties to predict a surplus in 2019/20.
The case for monetary policy easing is clearly continuing to build, very much in line with Westpac’s view. However, we still see the situation favouring a first 25bp rate cut from the RBA coming in August, once the extent of spillovers from the housing downturn, on the labour market in particular, become more apparent, with a follow-up 25bp cut in November.
The week that was
Beginning first with our Westpac-MI Consumer Sentiment Survey, March saw a material deterioration in household views on the economy, headline sentiment falling 4.8% to 98.8 – its lowest level since September 2017, and below the ‘100’ optimist/ pessimist divide. The disappointing Q4 GDP report clearly affected households’ confidence in the economy, with responses received after its release 8% lower. It is not surprising then that both the 1-year and 5-year views on the economy fell sharply, respectively 6.9% and 5.5%. With respect to the labour market, consumers have also become more circumspect, an 8.9% jump in unemployment expectations in March taking the sub-index to a 18-month high. It is best to regard this shift as signalling an expected deceleration in employment growth rather than a sharp drop, with unemployment expectations now near their long-run average.
The impact of these developments on family finances is significant. Both relative to a year ago, and for the year ahead, views on family finances are more than 5% below long-run average levels. ‘Time to buy a major household item’ is similarly 7% below its average. These results point to risks around the consumer remaining tilted to the downside, as headwinds from weak wages growth and declining house prices are further amplified by deteriorating employment prospects. On the housing market, affordability is improving as price declines continue, particularly in Sydney and Melbourne. However, consumers continue to expect further price declines. The survey’s house price expectations index has fallen to a new record low back to 2009. Unsurprisingly, NSW and Victoria are the worst affected, with circa 50% of consumers believing prices will be lower in 12 months’ time.
Also raising concern over our economy this week was the latest update from the NAB Business Survey. At +4 in February, business conditions are below average and down sharply from the level of H1 2018, when the index averaged +18. Business confidence is also below average at +2. In line with the rise in consumer unemployment expectations back to long-run average levels, businesses’ willingness to hire has also ebbed to a level consistent with a stable unemployment rate. As the labour market typically lags activity, we foresee further weakness in this measure in coming months. On investment, the capital expenditure index is approaching the lowest level back to 2014/15, and capacity utilisation is now below average.
The above developments further support our view that the Australian economy needs easier policy. The full rationale for our call for two 25bp cuts in the cash rate in 2019 can be found in our March Market Outlook on pages 6 and 8. This release also provides commentary on the outlook for the Australian dollar and developments in global FX markets.
Looking offshore, for the UK, the past week has been high on drama, with three Brexit votes in Parliament. First, Prime Minister May’s deal was voted down for a second time. Then a ‘no deal’ Brexit was precluded by the second vote. And finally via the third vote, scope for an extension of the Article 50 negotiation period was approved. While the second and third votes are positive steps, they do not narrow the divide between the various political factions. Indeed, the potential length of the extension is particularly divisive. If PM May’s agreement is successful, Parliament have agreed on an extension to 30 June. But, if unsuccessful, uncertainty is set to remain rife as the extension date for this scenario was not made absolute by the third vote. It is likely that the EU will push for as lengthy a negotiation period as possible. In our view, this is the best that can be hoped for, in order to allow perspective and time for fruitful discussions.
Finally to China. The past two weeks have seen the 2019 National People’s Congress and a slew of data updates following the Lunar New Year holidays. At the Congress, authorities maintained their focus on quality development and long-term prosperity. The lower and wider growth target for 2019, of 6.0%–6.5% versus 2019’s ‘around 6.5%’, speaks to this intent and to the headwinds from softer global growth and US/China trade tensions. A full discussion of the economic initiatives highlighted by the Congress is on page 22 of our March Market Outlook; but from Australia’s perspective, of greatest importance is growing support for infrastructure spending by local governments and business investment more broadly (a positive for commodities), and a drive to foster more profitable industry which begets higher incomes for households (supportive of greater demand for Australian service exports).
In terms of the data to hand, industrial production disappointed in February, but fixed asset investment met expectations. More importantly though, the breadth of investment growth looks to be widening, creating a sounder base for activity hence. Finally, taken together, the January and February credit data point to 2019 funding for local government spending being front loaded, and banks putting to work liquidity freed up by 2018/19’s Reserve Requirement Ratio cuts.
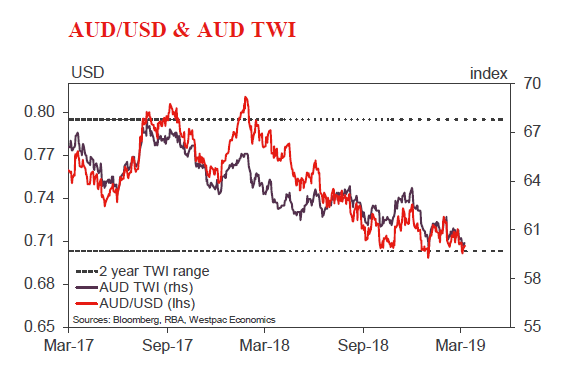
Chart of the week: the Australian Dollar
It has been an eventful month for the Australian economy, with GDP and other key data surprising to the downside, and interest rate expectations shifting. Regardless, at USD7093, the Australian dollar is unchanged from USD0.7093 when our February Market Outlook went to print, having held a fairly tight range of USD0.7009 to USD0.7183 since.
Our forecasts see that by end-2019, the policy rate differential between Australia and the US would stretch to –163bps – a highly-abnormal spread versus history. Against the scale of the above Australia/ US differentials for growth and interest rates, our forecast for around a 4% decline in the Australian dollar to USD0.68 in the second half of 2019 appears modest.
The justification for maintaining this forecast is two-fold: (1) key commodity prices continue to hold up better than anticipated; and (2) demand for Australian assets from foreign investors remains very strong.
New Zealand: week ahead & data wrap
Next week we should get confirmation of the slowdown in growth in the second half of 2018 with the release of December quarter GDP data. Our view is that this slowdown will prove temporary, with momentum set to improve in 2019, supported by high government spending, a strong pipeline of construction work, and a lift in labour incomes. On balance, data released this week tended to support that view.
We expect next week’s report will show that GDP grew just 0.3% in the December quarter, after an equally modest gain in September. Our forecast is at the lower end of market expectations, and is significantly below the 0.8% GDP growth the RBNZ forecast in its February Monetary Policy Statement. If we’re right that would see annual GDP growth fall to 2.7%, down from 3.1% in 2017 and 3.9% in 2016.
Some of the softness in growth in the December quarter is genuine. Importantly, the December Quarterly Employment Survey indicated less activity was taking place in the business and personal services sectors. But this weakness was also exacerbated by some temporary disruptions in the energy sector. Output from the Pohokura gas field was again interrupted this quarter (which will have a flow-on effect on methanol production). Meanwhile low hydro lake levels will directly weigh on electricity production with the subsequent lift in electricity prices to reduce demand from manufacturers.
Brighter spots in next week’s GDP data are likely to include a strong lift in retail spending (after a subdued September quarter), a pickup in residential and commercial construction activity and increased spending on government services.
The big question is whether the late-2018 loss of momentum will continue into 2019. We think not. We expect GDP growth to recover.
A core component of this view is that consumer spending will strengthen in 2019 as petrol prices remain relatively flat and households benefit from rising wages and the range of new assistance measures from the Government. This week’s retail card spending was supportive of the view. Data showed a healthy 0.9% lift in card core spending in the month (which excludes spending on fuel and autos), bringing the annual growth to 5.1%. After some unusual volatility in this measure in recent months (largely related to durable spending) February data signaled a return to the pace of growth in retail spending that was prevailing before the sharp lift in oil prices put a brake on other retail spending late last year.
Other data we’ve seen in recent weeks which support a brighter outlook for 2019 include a more positive outlook for export earnings thanks to rising dairy prices and a jump in the number of residential building consents issued.
In contrast, there was mixed support for our view from this week’s housing data. February REINZ data did show nationwide house price inflation accelerating over the New Year, as we expected. Nationwide house prices rose around 0.7% in February and were up 1.3% over the summer as a whole (December through to February). This was a step up from the pace of house price inflation in the spring months. However, it looks increasingly like this ‘summer fling’ will prove brief.
The number of house sales provides one of the best shortterm leads on house prices, and took another big step down in February. Seasonally adjusted house sales fell 5.8% in the month. REINZ data understates the number of house sales in its initial release, but even if the true fall in house sales was closer to 4%, it comes on top of several months where house sales have been trending lower. The drop in turnover has been particularly stark in Northland, Auckland and Waikato, suggesting that the north of the country in particular is about to experience further house price weakness. In Auckland, the drop in sales has not been matched by a drop in listings, meaning a surplus of unsold homes on the market. Realestate. co.nz reports there are currently 9,400 unsold homes on the market in Auckland, up 50% on three years ago. What’s more, homes are taking longer to sell. Nationwide the average time to sell has risen to 40 days, up from 37.5 a year ago.
Putting it all together, and it looks like house price inflation will fall a bit short of the 3% we had been expecting in 2019. Given how closely house prices and consumer spending are entwined, there’s a risk of a small knock on effect for consumer spending, although clearly house prices are not the only factor at play when it comes to determining how far households decide to open their wallets.
One reason we expect stronger momentum in the economy in 2019 to prove temporary is the outlook for slowing population growth in the coming years. But getting a clear idea of how net migration flows (which are the key swing factor determining changes in the pace of population growth) are evolving has been challenging to say the least.
The February data confirmed that net migration numbers have become something of a lottery under Stats NZ’s new methodology. This week’s data suggested monthly net migration has shot up from under 5,000 to above 6,000 in the past two months, largely due to arrivals of French and German migrants. We find this very hard to believe. More likely, Stats NZ’s new methodology is introducing volatility to the series.
For now, our view remains that annual net migration flows will continue to ease. At face value recent migration data challenges our assessment of the pace of this slowdown. But with such wild swings in the data being reported, we’re reluctant to go very far down this path until we have a clearer understanding of just what’s going on.
Data Previews
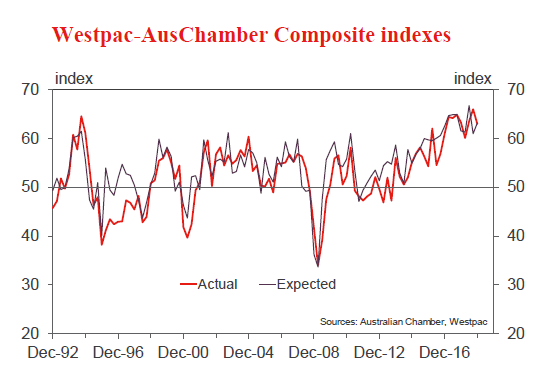
Aus Q1 AusChamber-Westpac business survey
- Mar 19, Last: 63.1
The Australian Chamber-Westpac survey of the manufacturing sector provides a timely update on conditions in the sector and insights into economy-wide trends. The Actual Composite tracks a range of demand related measures including investment and employment. The Q1 survey was conducted from February to March.
In Q4, the Actual Composite declined to 63.1 from 66.5 in September. The Composite is supported by new orders, output employment and order backlog.
Manufacturing is benefitting from a rise in public infrastructure and a relatively low AUD. However, home building activity is now in a downturn and there are likely to be spill-over effects from the drought in NSW and Queensland.
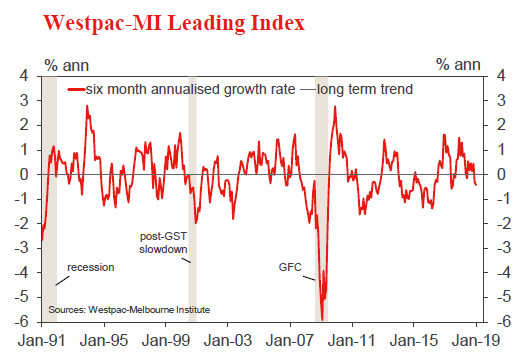
Aus Feb Westpac–MI Leading Index
- Mar 20, Last: –0.43%
The six month annualised growth rate in the Westpac– Melbourne Institute Leading Index, which indicates the likely pace of economic activity relative to trend three to nine months into the future, fell to –0.43% in January. Despite some choppiness, the major trend is consistent with growth slowing to a below trend pace.
The Feb read will include a mixed bag of component updates. Positives include strong gains for the sharemarket (ASX200 up 5.2% vs 3.9% last month) and commodity prices (up 4.6% in AUD terms vs 3.9% last month); and a small recovery in dwelling approvals. The main negatives are around sentiment, with the Westpac-MI Consumer Expectations Index down -6.1% and the Westpac-MI Unemployment Expectations Index deteriorating 8.9%. The balance is likely to see another soft read.
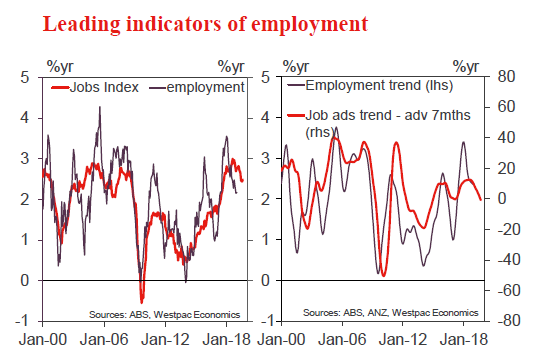
Aus Feb Labour Force Survey – employment ‘000
- Mar 21, Last: 31.9k, WBC f/c: –5k
- Mkt f/c: 15k, Range: -5k to 30k
Total employment lifted a solid 39.1k in January, well clear of the market median of 15k. The year started with a solid trend pace of employment growth with a three month average gain of 31.9k. While it is just one month into the year, employment has gained 271k in the year to January (2.2%yr) with a very solid 2.9%yr six month annualised pace.
There is, however, an important caveat – January is the peak holiday month in Australia as Christmas, New Year and school summer vacation all come together. Little business happens in Australia at this time.
The leading indicators are softening but they are not pointing to a collapse in employment (at this stage). We believe that employment growth is set to stall through the first half of 2019 but our –5k forecast for February is more about monthly volatility than the start of a new trend.
Aus Feb Labour Force Survey – unemployment %
- Mar 21, Last: 5.0%, WBC f/c: 5.1%
- Mkt f/c: 5.0%, Range: 4.9% to 5.1%
Despite the strong gain in employment, the unemployment rate was flat in January at 5.0% (market median was for 5.0%) as a 0.1ppt lift in the participation rate to 65.7% (65.72% at two decimal places) boosted the gain in the labour force by 45.7k.
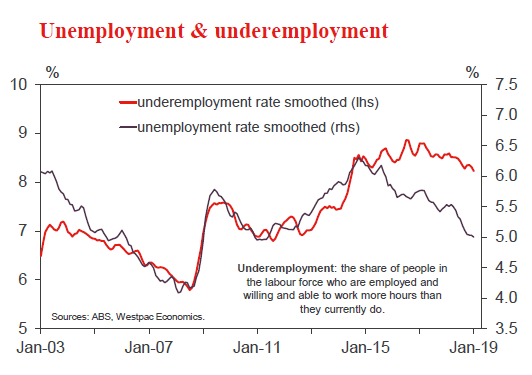
It is also worth noting that 2018 produced a –0.2ppt decline in the underemployment rate from Q1 to Q4. In January there was a further improvement in underemployment to 8.2% (from 8.3%) the lowest print in underemployment since March 2015. Again, we would caution that this is a January print so would not project that this improvement can be sustained but nevertheless, it is another indicator of just how robust the labour market was through 2018.
Holding the participation rate flat at 65.7%, our forecast for a –5k fall in employment will see the unemployment rate tick up to 5.1%.
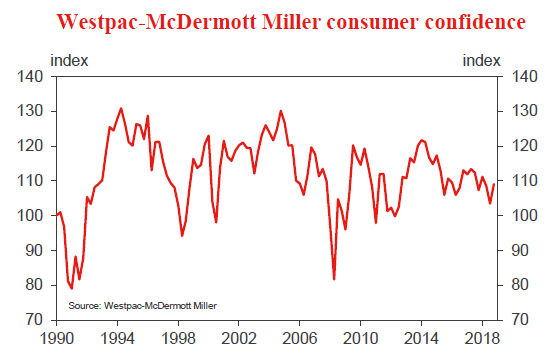
NZ Q1 Westpac McDermott Miller Consumer Confidence
- Mar 19, Last: 109.1
Consumer confidence picked up in December, shaking off its mid-year slump. That was supported by the fall in fuel prices in late 2018, along with signs the housing market was firming in some parts of the country. December’s gains in confidence were widespread across regions, age brackets and income groups.
Since the time of the last survey, we’ve seen downward pressure on interest rates and an easing in mortgage lending restrictions. There’s also been an increased focus on tax policy, including the possible introduction of a capital gains tax, following the release of the Tax Working Group’s final report in February.
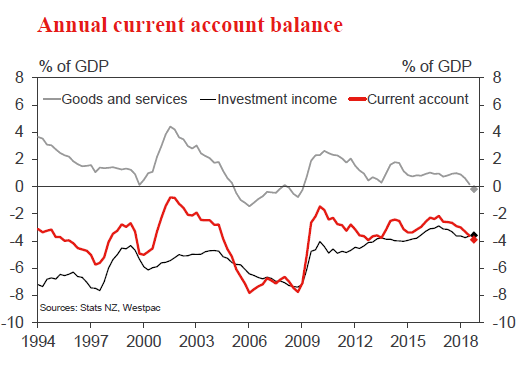
NZ Q4 current account % of GDP
- Mar 20, Last: -3.6%, WBC f/c: -3.9%, Mkt f/c: -3.9%
We expect the annual deficit to widen further from 3.6% to 3.9% of GDP. This would match the deficit in the December 2012 quarter, which in turn was the largest since the GFC.
The widening in the deficit has been driven by the goods trade balance. The terms of trade fell over 2018 as dairy export prices fell and oil import prices rose (though both of those have turned around in the early part of this year). In addition, import volumes have remained surprisingly high relative to domestic demand.
In contrast, there has been little change in the investment income deficit, with profits of overseas-owned firms and interest costs on overseas debt broadly flat over the last year.
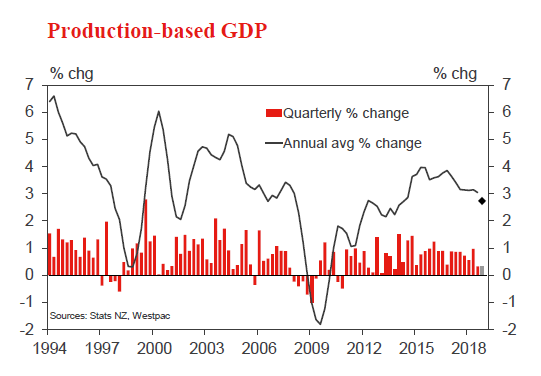
NZ Q4 GDP
- Mar 21, Last: 0.3%, WBC f/c: 0.3%, Mkt f/c: 0.6%
We expect just a 0.3% rise in GDP for the December quarter, following an equally soft gain in the September quarter. Our forecast is at the bottom of the range of market forecasts, and substantially below the RBNZ’s forecast of 0.8%.
There does seem to have been some genuine loss of momentum in the second half of last year. However, in the December quarter this was exacerbated by some temporary disruptions to gas and electricity supplies.
Consumer spending and construction are likely to be the highlights for the quarter, in contrast with the housing-led slowdown in these components in Australia.
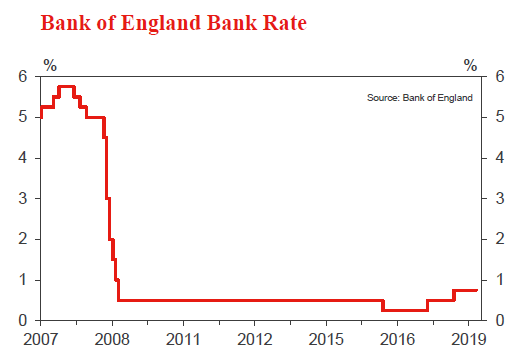
UK Bank of England Bank Rate
- Mar 21, Last: 0.75%, WBC f/c: 0.75%, Mkt f/c: 0.75%
In February, the BOE left the Bank rate unchanged and maintained its very mild tightening bias. However, the assumed tightening was contingent on economic conditions following the UK’s exit from the EU, and the BOE noted that Brexit related uncertainty had intensified.
Since the BOE’s last update, economic activity has remained middling. Importantly, there’s been no real progress on Brexit negotiations. Parliament intends to seek an extension to the negotiation period, but for businesses this means the continuation of the economic uncertainty that has been a significant drag on investment plans. Against this backdrop, there’s no chance of a change in the Bank Rate this month, and the BOE will emphasise the conditionality of its forecasts.
US Mar FOMC meeting
- Mar 19–20, Last: 2.375%, WBC f/c: 2.375%
The FOMC’s March meeting will not only provide an updated qualitative assessment of the outlook, but also the first set of revised quantitative economic forecasts since the Committee’s collective dovish turn at the start of this year.
With data since decidedly mixed in tone, growth and inflation forecasts are under pressure. That said, the scale of downward revisions is unlikely to be significant. Growth at or above trend in 2019 is still the most appropriate core expectation to hold for the US – unlike Europe.
The market’s primary focus for the FOMC’s post-meeting communications will be ‘the dots’, i.e. Committee estimates of the fed funds rate over the forecast period. A downward revision has to be expected. But, given the strength of the labour market, some probability of a hike will remain. We continue to forecast one more hike in December 2019.


