
The Australian dollar jumped today after Caixin released China’s PMI data for the month of May. The data showed that the PMI remained at 50.2, which topped the analyst forecasts of 50.0. Meanwhile, data from Australia disappointed, with the manufacturing PMI declining to 51.0 from the previous 50.9. The ANZ job advertisements declined by -8.4% in April. This data came ahead of the RBA interest rates decision, which is expected tomorrow and the final reading of Q1 GDP, which is expected on Wednesday.
It was a sea of red in the Asian stocks as the trade war continued over the weekend. On Sunday, China reacted to the Huawei ban by starting to investigate FedEx, the American shipping giant. The country also announced that it would ramp up investigations of business practices of other US companies. Nonetheless, the country showed interest in having talks with the US on these issues. In China, the Shanghai Index declined by 20 points while in Japan, the Nikkei declined by 255 points. In the US, Dow and S&P 500 futures declined by 150 and 15 points respectively.
Later today, investors will watch out for key economic data from a number of countries. In the morning, Switzerland will release its CPI data, which is expected to show that the CPI rose by 0.6% in May. This will be slightly lower than the 0.7% in April. In Turkey, the CPI is expected to have eased slightly in May to 19.10% from the previous 19.50%. In Sweden, the retail sales are expected to have risen by 0.4% in April. In Germany, the manufacturing PMI is expected to have remained at 44.3. In the US, data from ISM is expected to show that the manufacturing PMI rose slightly to 53.0.
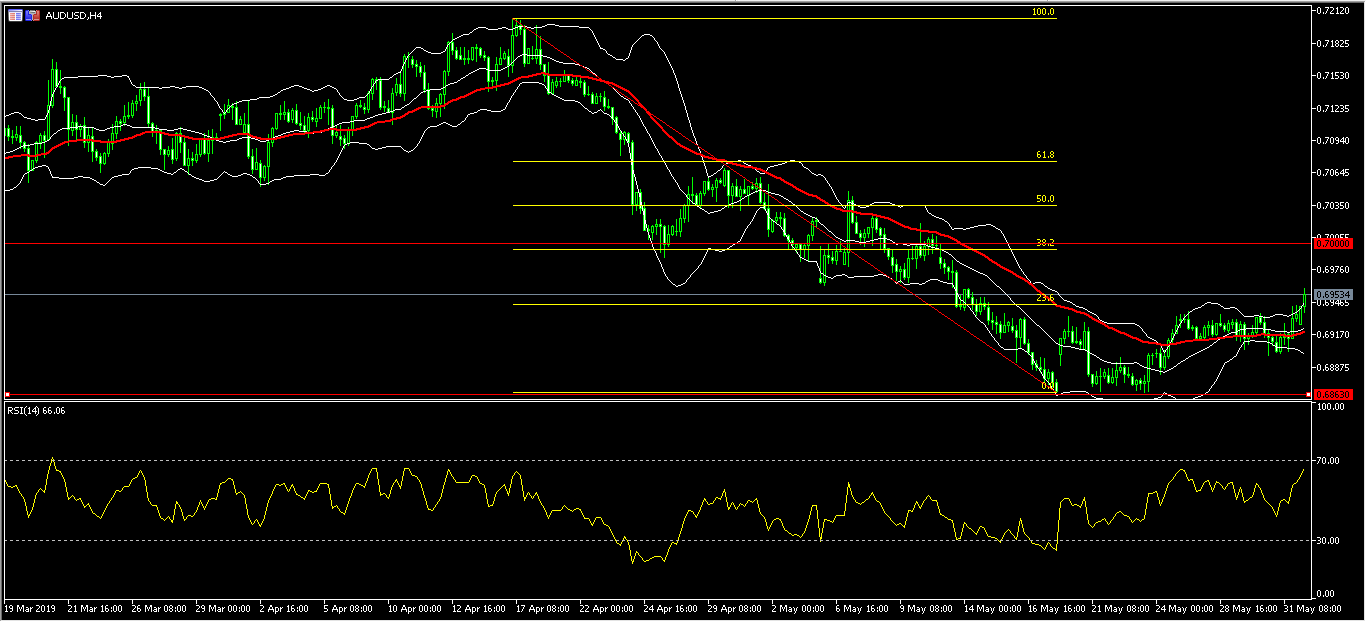
AUD/USD
The AUD/USD pair rose to a high of 0.6958. This was the highest level since May 14. On the four-hour chart, the pair’s price is slightly above the 23.6% Fibonacci Retracement level. This price is along the upper line of the Bollinger Bands and above the 50-day moving averages. The RSI has moved up, close to the overbought level of 70. The pair will likely continue to move up to test the 38.2% Fibonacci Retracement level of 0.7000.
EUR/USD
The EUR/USD pair rose sharply to a high of 1.1190 as the dollar weakened following the developments on trade. On the hourly chart, the pair is above the 50-day and 25-day moving averages, while the RSI has almost moved to the overbought level of 70. The pair is trading along the upper line of the Bollinger Bands while the momentum indicator is rising. The pair will likely test the important resistance level of 1.1200.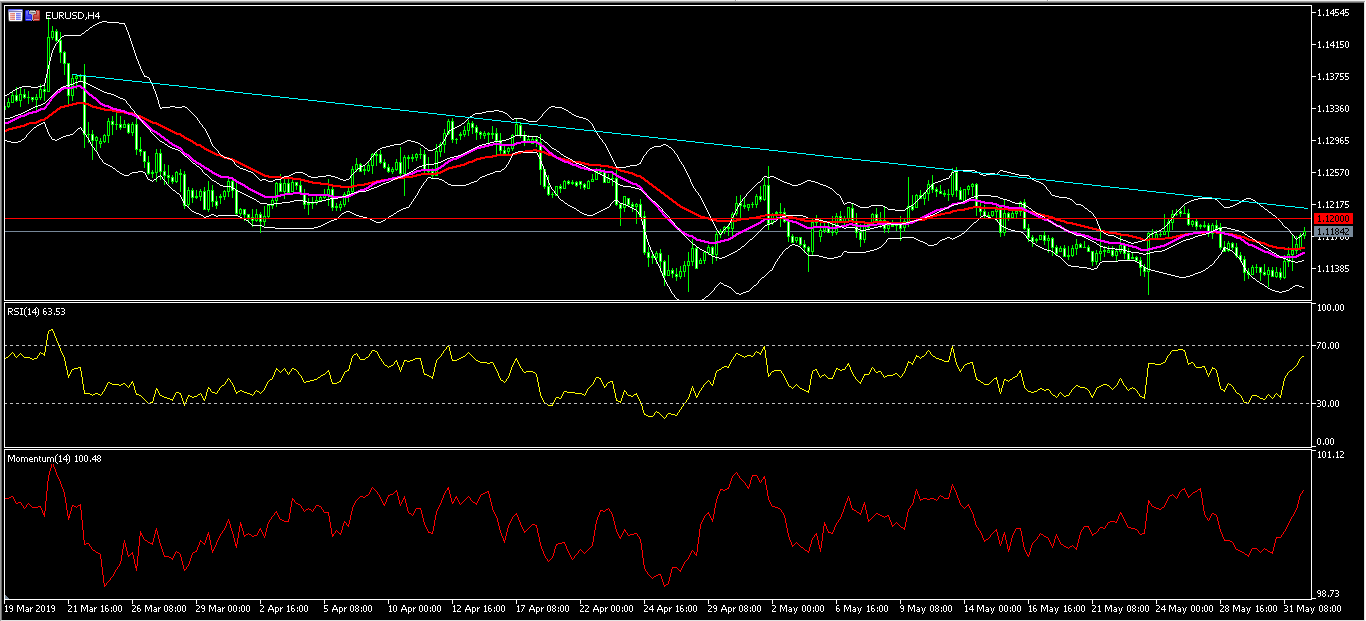
XBR/USD
The XBR/USD pair declined sharply as the trade war rhetoric continued over the weekend. It also declined as Russia withdrew defense support to Venezuela. The pair reached a low of 60.50. On the hourly chart, the price is trading along the lower line of the Bollinger Bands while the RSI dropped to the oversold zone. The Parabolic SAR dots are on the right side of the price. While the pair will likely continue the downward trend, there is a likelihood that it will reverse.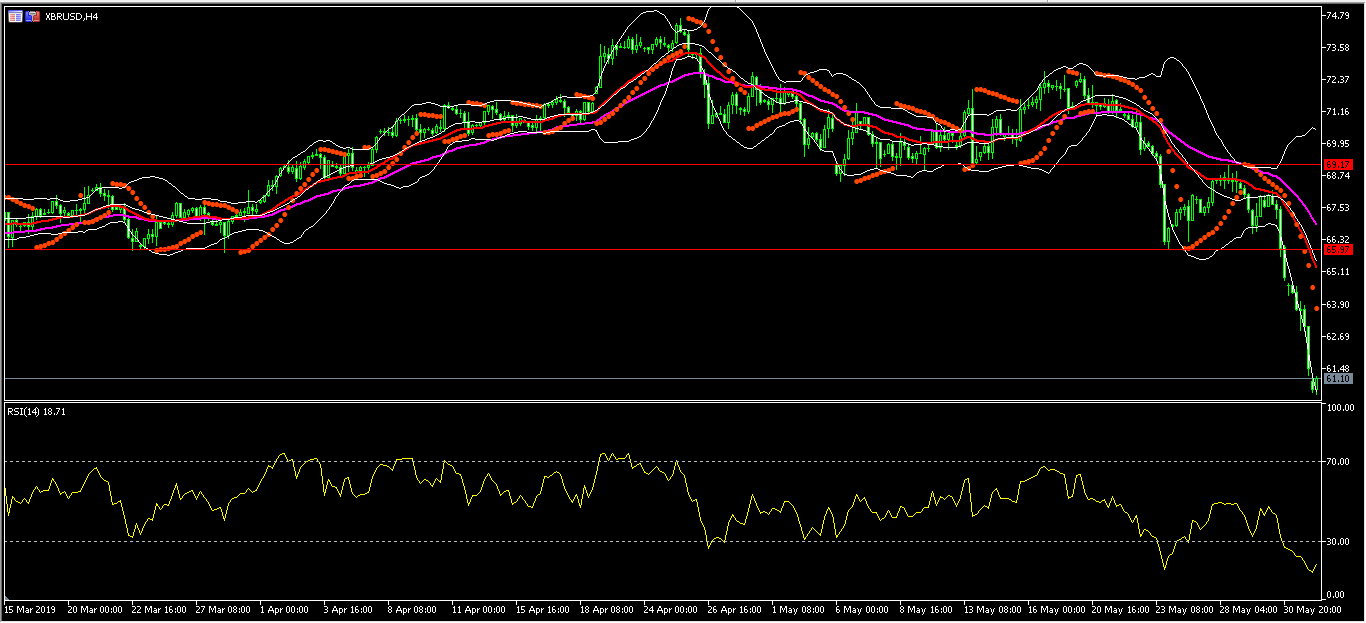


