
The price of crude oil declined after data from EIA showed that the US had increased its oil production in October. The US producers increased production by more than 600k barrels in October to a record 12.4 million barrels. This output was boosted by a 30% increase in output from the Gulf of Mexico. This solidified the US as the world’s biggest oil producer. At the same time, demand for gasoline rose to a record 9.82 million barrels a day in the month. Demand for diesel rose to more than 4 million barrels. This data came a day after the EIA reported its weekly numbers. In the past month, inventories increased by 5.7 million barrels, which was higher than the consensus estimates of 494k.
The US dollar was relatively unchanged ahead of the important jobs numbers from the Labour department. The market expects data to show that the NFP rose by just 89k in October. This will be significantly lower than the previous 136k. Manufacturing payrolls are expected to have declined by 50k in October. Private NFP is expected to have increased by just 80k. The unemployment rate is expected to increase slightly from 3.5% to 3.6%. Meanwhile, average hourly earnings are expected to have increased slightly by 3.0%. The market will also receive ISM manufacturing PMI data from the US.
Asian stocks and global stocks were mixed after Caixin released China’s PMI data. Data showed that manufacturing PMI increased to 51.7 in October. This was higher than the consensus estimates of 51.0. It was also higher than the September PMI of 51.4. This data came a day after China Logistics released its PMI data. The number showed that manufacturing PMI declined to 49.3 from 49.9 while non-manufacturing PMI gained to 52.8. The two numbers have always differed. In September, data from Caixin and China Logistics showed that the manufacturing PMI was at 51.0 and 49.9 respectively.
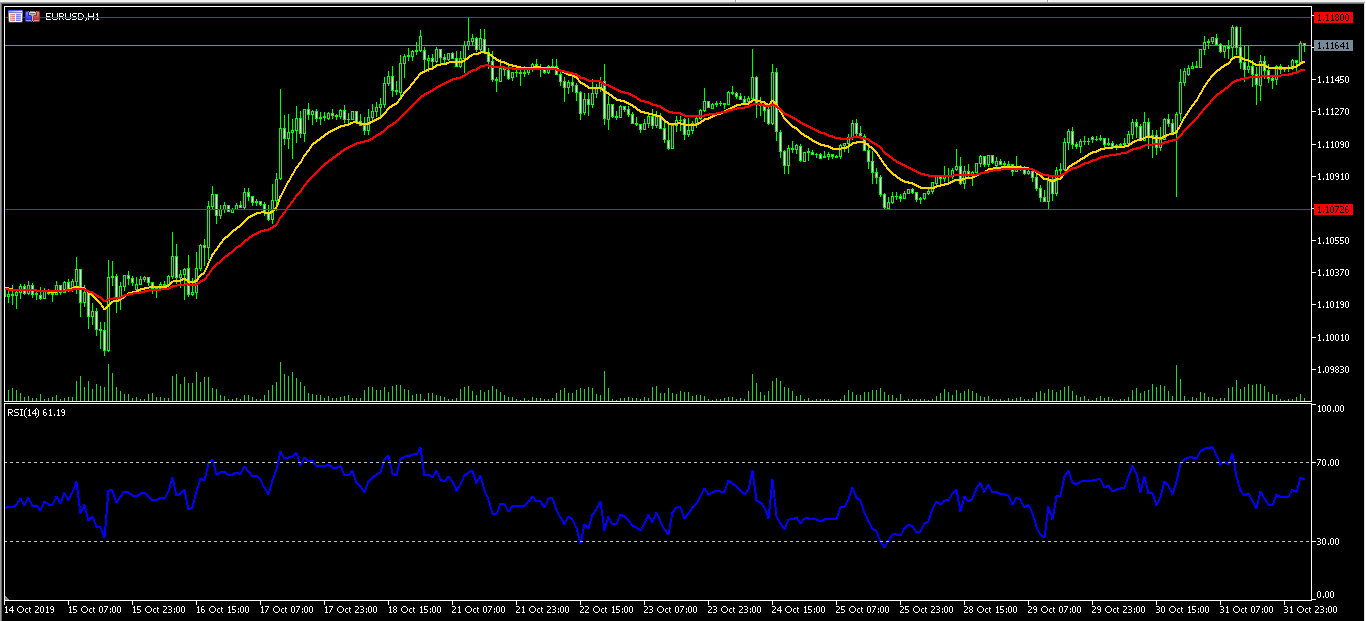
EUR/USD
The EUR/USD pair rose in the Asian session after the Chinese PMI data. The pair rose from yesterday’s low of 1.1130 and reached a high of 1.1166. On the hourly chart, this price is above the 14-day and 28-day moving averages. The RSI has moved from a low of 45 to 60. The pair has also formed – and almost completed – the cup and handle pattern. Therefore, there is a possibility that the pair will continue moving higher.
XBR/USD
The price of crude oil fell sharply during the American session. The pair dropped from a high of 60.61 to a low of 59.00. The pair rose slightly during the Asian session to a high of 59.48. This week, the pair has dropped from a high of 62.04. On the hourly chart, the pair is trading between the lower and middle line of the Bollinger Bands. RSI has moved from a low of 27 to a high of 40. The pair will likely continue the downward trend to test the important support of 58.00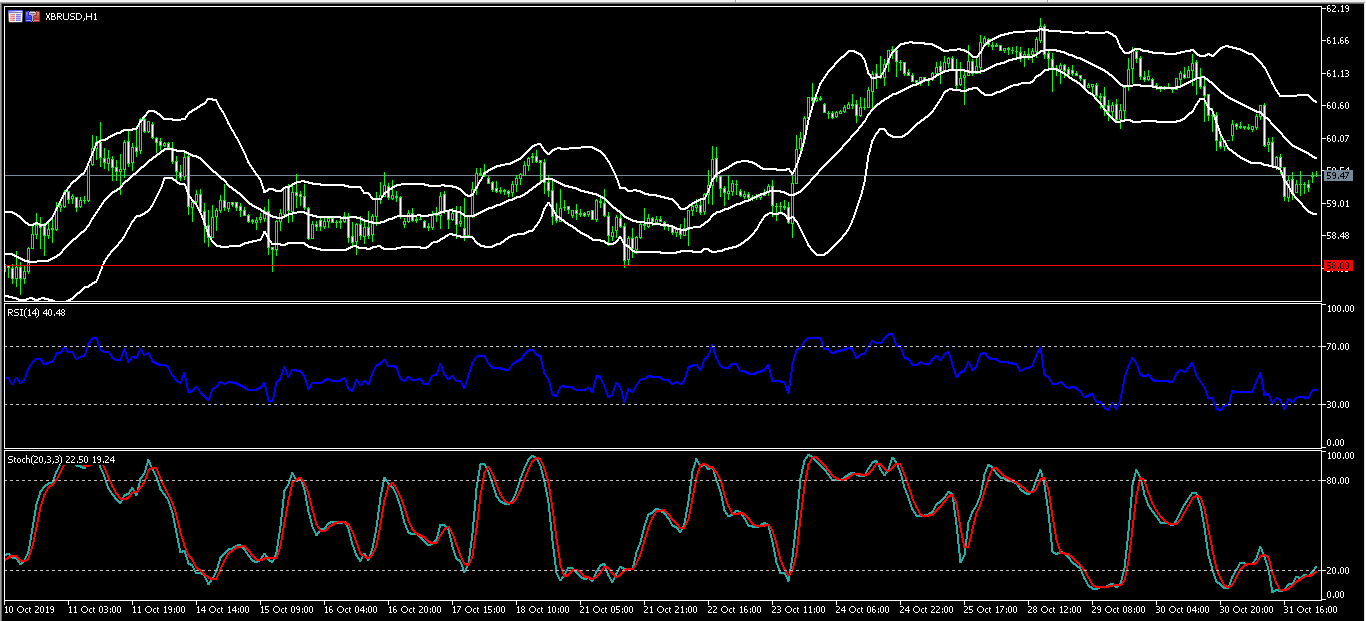
USD/CHF
The USD/CHF pair continued to decline as the dollar weakness continued. The pair reached a low of 0.9858. This week, the pair has declined from a high of 0.9970. On the hourly chart, the pair is below the 14-day and 28-day moving averages. The pair has formed an inverted cup and handle pattern. The RSI has moved from a low of 12 to a high of 12. The Momentum indicator has risen and is slightly below the 100 level. The pair might continue moving lower.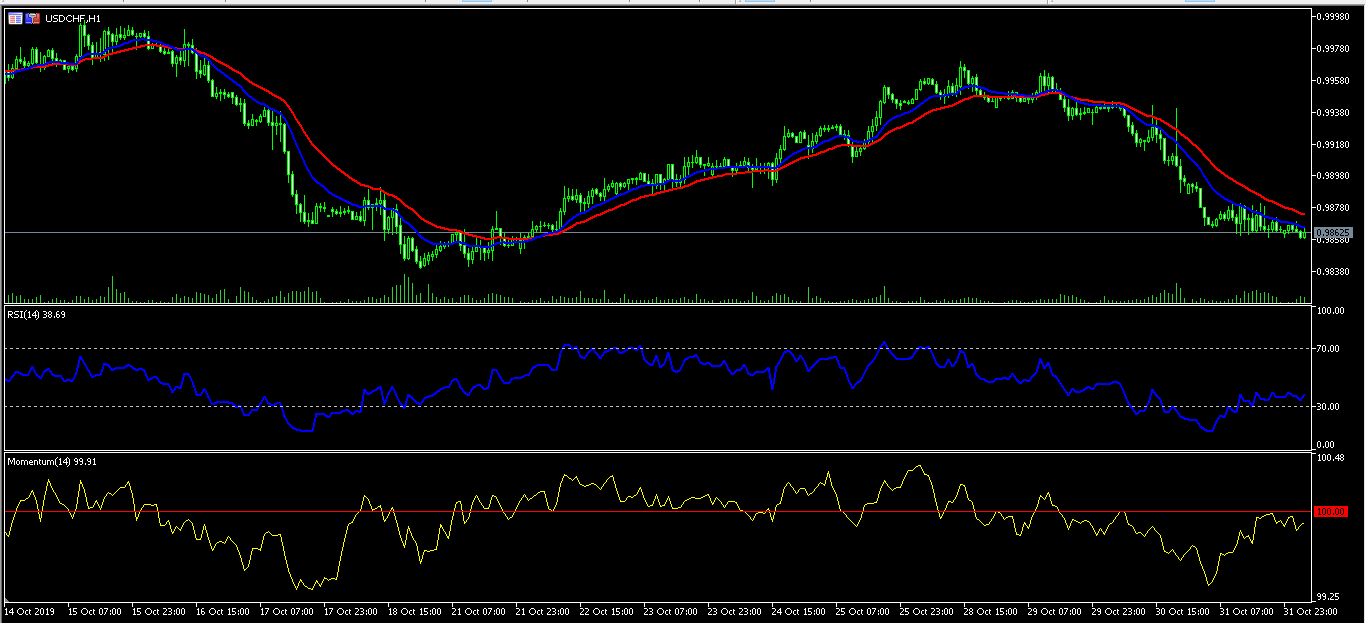


