
U.S. Review
The U.S. Economy Appears to Have Bottomed in April
- The beginning of this week saw some optimism that the economic downturn could be relatively short-lived, but data through the rest of the week provided grim reminder of the economic damage from COVID-19.
- Jobless claims declined for the eighth straight week, but continuing claims posted their first decline during the pandemic period, a positive signal for the labor market.
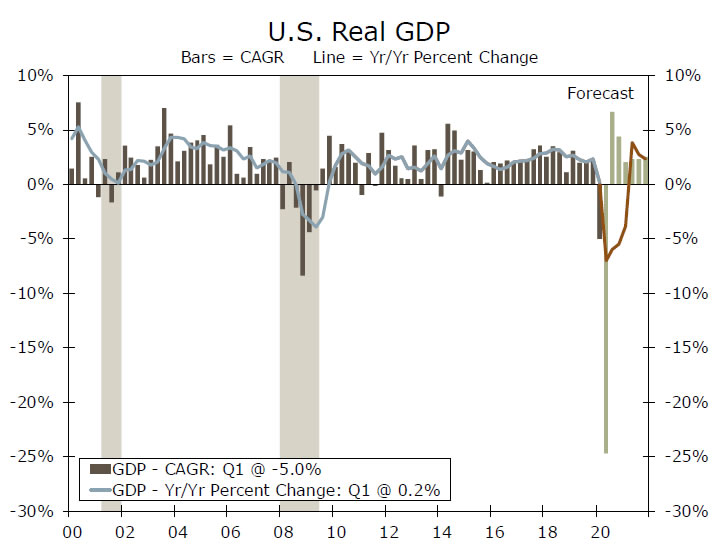
- The second estimate of Q1 U.S. output revealed a slightly worse decline in real GDP. Q2 will be much worse.
The U.S. Economy Appears to Have Bottomed in April
It was a busy week for the U.S., with data at the beginning of the week providing some renewed optimism as states gradually re-open and ease strict lockdown measures.
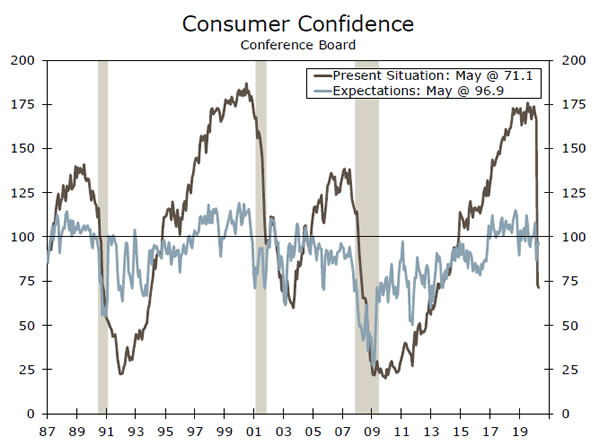
The May consumer confidence report was one encouraging signal. Consumer confidence rose 0.9 points to 86.6 in May, after sharp, back-to-back monthly declines in March and April. Overall, the level of consumer confidence remains well-below readings from the past several years, but for now, it appears the free-fall in confidence has ended. The forward-looking expectations component continued to recover in May, rising for a second straight month to 96.9 from 94.3. Consumers’ assessment of current business and labor market conditions, on the other hand, declined further to 71.1, the lowest level in seven years, and has plunged roughly 100 points since the virus outbreak. Moreover, the proportion of individuals seeing jobs as “hard to get” or “not so plentiful” exceeded 80%. Thus, it remains clear that majority of consumers are still concerned about their own financial conditions amid widespread layoffs and an uncertain path to U.S. economic recovery.
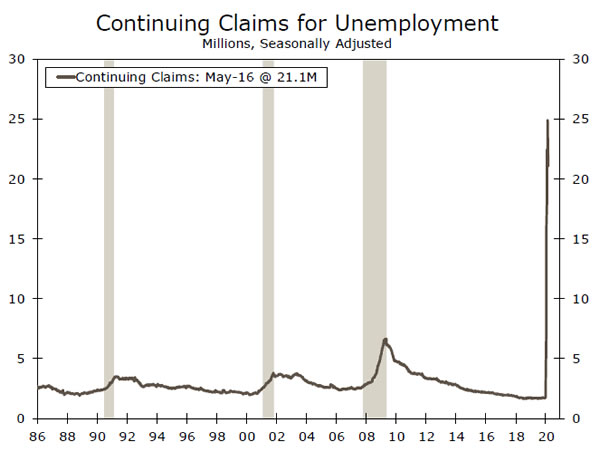
That said, the number of Americans filing initial unemployment claims continued to decline, with ‘only’ 2.1 million claims filed for the week ended May 23, the lowest amount filed since the pandemic-induced job loss began in March. Continuing claims, or the number of individuals who remain unemployed and receiving benefits, also showed some improvement, falling 3.9 million for the week ended May 16, the first decline during the pandemic period. While the number of people filling for and receiving unemployment remains at a gut-wrenching level, it appears to be moving in the right direction.
Despite some improved optimism, other U.S. data released this week continued to reveal the negative economic impact of the coronavirus. For starters, U.S. durable goods orders sank 17.2% in April, one of the largest declines on record. Core capital goods orders, which exclude aircraft and military hardware, fell 5.8% while shipments of those goods declined 5.4%. However, there may have been some offsets as orders for computers & electronics products fell only 0.3%, as businesses tried to supply employees to work from home.
The second estimate of Q1 real GDP showed a 5.0% annualized rate of decline, worse than the 4.8% decline that was originally reported, due to a larger drawdown in inventories. That said, incoming data still suggest an even sharper decline in Q2.
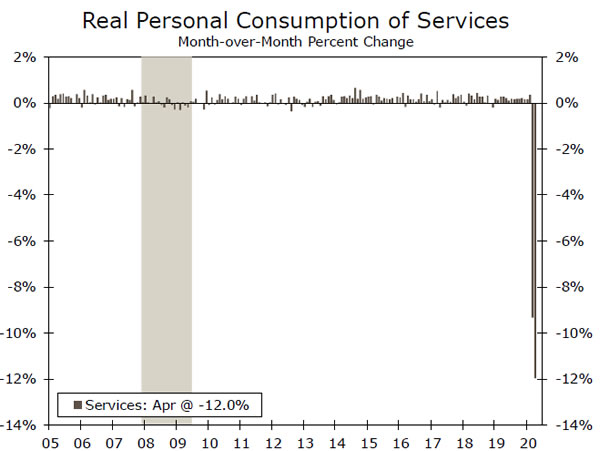
Personal spending plunged 13.6% in April, the largest decline on record. Forecasts for Q2 consumer spending will likely be revised sharply lower, given real consumer spending is heading into the second quarter falling at a three-month annualized rate of 56.8%. Incomes, however, posted the largest monthly increase on record, rising 10.5%, but that was a result of a massive surge in government transfer payments. All told, we look for real GDP to plunge at an unprecedented rate in the second quarter.
U.S. Outlook
Construction Spending • Monday
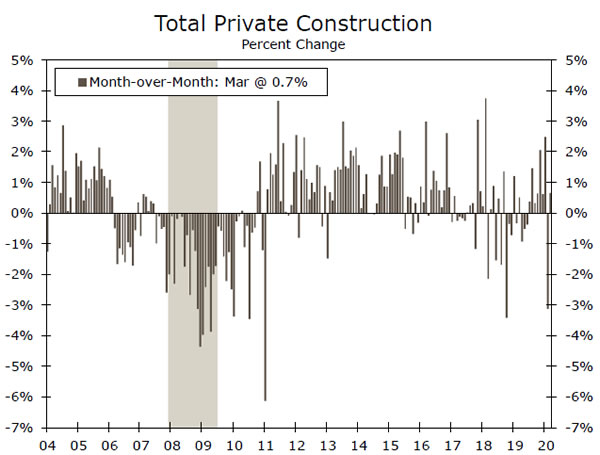
Construction spending growth posted a surprising gain in March, boosted by an outsized increase in public sector construction spending. But even private sector spending growth was positive, up 0.7% month-over-month on the back of a 10.2% surge in home improvement spending.
The April data are likely to be far less forgiving. The Bloomberg consensus is for a 7.0% month-over-month decline. While this would be a significant decline for just one month, the more important question is whether this decline is followed by more. As shown in the chart to the right, private construction spending declined by 3%-4% per month for much of late 2008/early 2009 as the real estate market was in correction. If April’s reading is just a bad blip, it would bode well for the recovery in the second half of the year. One risk to this outlook is public sector construction spending, as state and local governments face precarious fiscal outlooks.
Previous: 0.9% Wells Fargo: -7.5% Consensus: -7.0% (Month-over-Month)
ISM Non-Manuf. Index • Wednesday
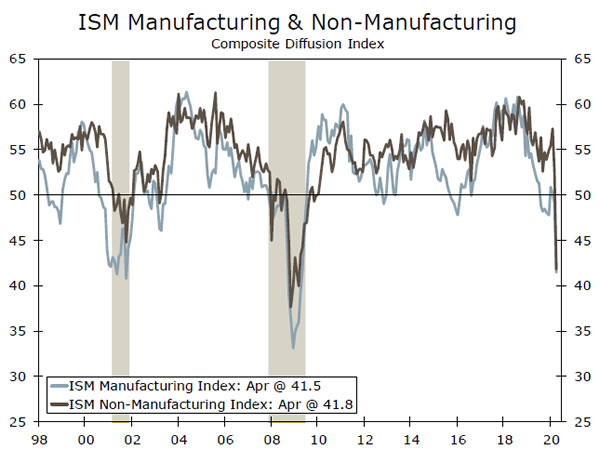
The headline drop to “only” 41.8 in the non-manufacturing ISM was underpinned by the fact that supplier deliveries soared to 78.3 in April as the shutdowns made it hard to get deliveries. New orders fell to 32.9, business activity cratered to 26.0 and the employment component fell to 30.0. All were all-time record lows.
But even with such weak readings in the subcomponents, the data suggest that service sector activity in the United States in April was stronger than it was in some other major economies, such as the Eurozone. A different service sector PMI produced by IHS Markit was 26.7 in April in the United States compared to just 12.0 in the Eurozone. If both the ISM manufacturing and non-manufacturing indices tick higher in May as we expect, that would be an encouraging sign that April marked the bottom in economic activity in the United States. More telling, in our view, will be the June and July readings to determine the breadth of the recovery.
Previous: 41.8 Wells Fargo: 44.0 Consensus: 44.0
Nonfarm Payrolls • Friday
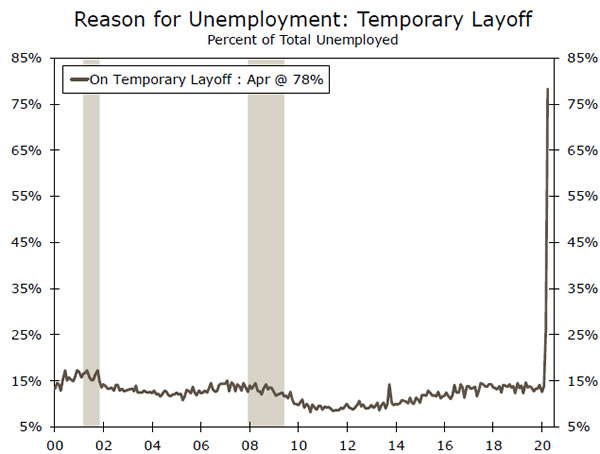
Before March, the biggest one-month decline in nonfarm employment in the last 70 years was March 2009, when payrolls declined by 800K. The 881K fall in March 2020 nonfarm employment was then followed by the unprecedented 20.5M decline in April. As we turn to May, our forecast is for another historic print of 8.0M jobs lost and for the unemployment rate to climb to 20%. One metric we will be watching closely is the reason given for unemployment. The current recession has been marked by an outsized increase in individuals citing “temporary layoff” as the reason for their job loss. As can be seen in the chart to the right, temporary layoffs rarely have much relation with the business cycle, whereas today nearly four-in-five workers believes their job loss is temporary. Just how many of these temporary layoffs turn into permanent ones remains the key question to be answered, in our view.
Previous: -20.5M Wells Fargo: -8.0M Consensus: -8.0M
Global Review
Keep Looking Forward, Don’t Look Back
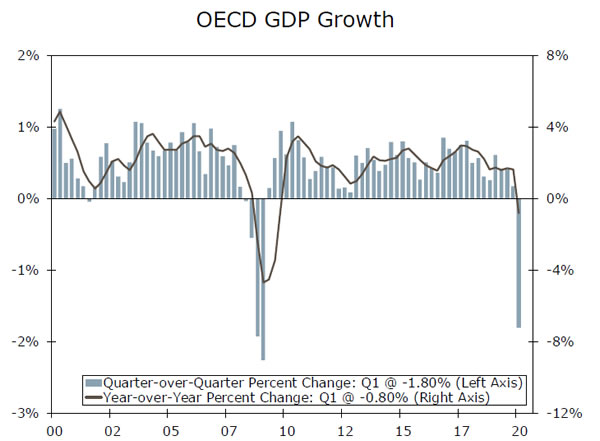
- Q1 GDP for the OECD economies, which includes most developed economies, fell 1.8% quarter-over-quarter and 0.8% year-over-year. Considering the slowdown seen in emerging economies such as China, India and Brazil, we expect the decline in Q2 GDP for the G20 economies to be even larger.
- Some modestly encouraging signs are starting to emerge. PMI surveys across many countries improved in May, as did German IFO business confidence and Eurozone economic confidence.
- That said, with the outlook still somewhat uncertain, we expect the ECB to ease monetary policy further next week.
Eurozone Economy Passing the Worst?
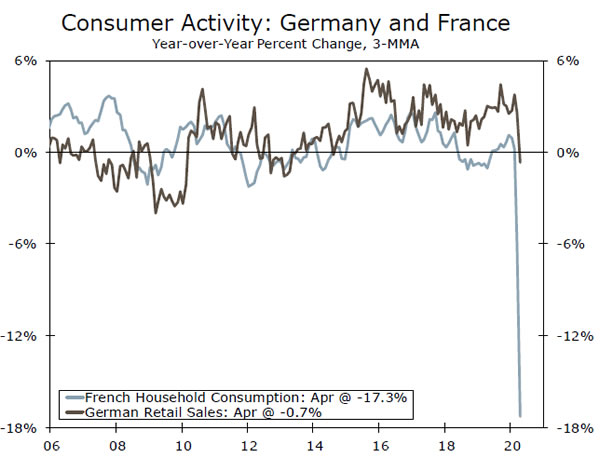
This week’s European data and events have been a mix of good and bad news. Looking first at the bad news, April German retail sales fell 5.3% month-over-month and French household consumption slumped 20.2%, contributing to a forecast 16.5% decline for overall Eurozone April retail sales. Meanwhile inflation remains frustratingly low and continues to move even lower, with the May CPI up just 0.1% year-over-year.
There are, however, hopes the Eurozone economy is passing the worst, and that a gradual economic recovery could begin in the second half of this year. Eurozone May economic confidence rose slightly to 67.5, including gains in manufacturing and consumer confidence. Similarly Germany’s IFO business confidence rose to 79.5, with a small fall in the assessment of current conditions more than offset by an improvement in the expectations component. Finally, there was also modest progress towards a more coordinated Eurozone fiscal response to the current downturn, with the European Commission proposing a €750 billion recovery package. That package is slated to include €500 billion in grants and €250 billion in loans, with significant resources to be directed towards Italy and Spain. Of course, further negotiation is needed, meaning a final package could differ and still be many months away. That said, we believe the European Commission announcement represents a constructive early step.
Submerging Growth Among Emerging Economies
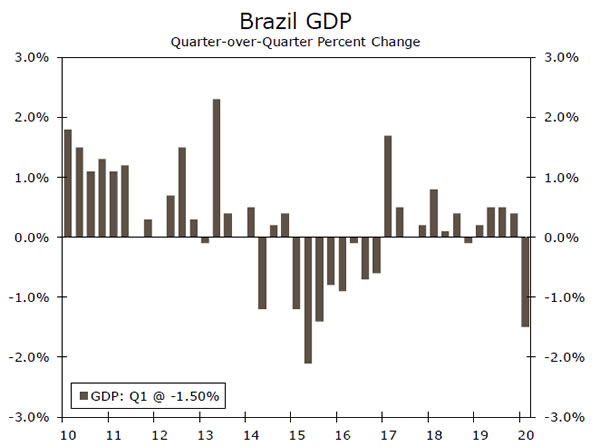
Two important emerging economies reported Q1 GDP figures this week, showing a slowdown and in some cases outright contraction in early 2020. Brazil’s Q1 GDP shrank 1.5% quarter-over-quarter, the first material decline since late 2016, with weakness concentrated in consumer spending and exports. Compared to Q1-2019, Brazil’s economy dipped 0.3%. The outlook for Q2 GDP looks much worse, with COVID-19 more widespread across Brazil and political jitters also likely to weigh on growth. Expect another, larger GDP decline in the current quarter, a trend which should see Brazil’s central bank continue on its monetary easing path. In India, Q1 GDP slowed less forecast t0 3.1% year-over-year, as growth in consumer spending slowed, while investment spending and exports showed outright declines. A further softening of GDP growth is likely in Q2.
Canadian Economy Starts its Slide
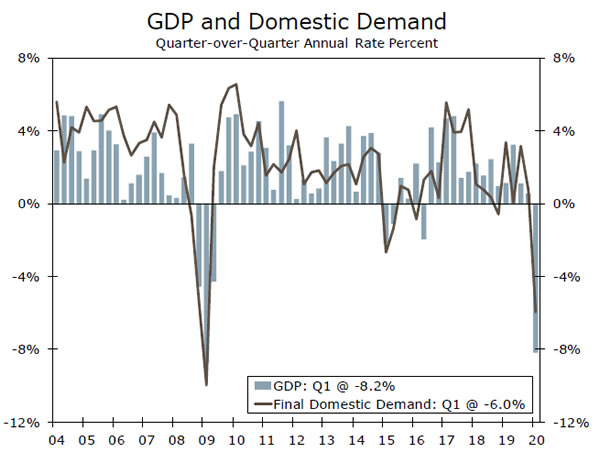
Canada’s Q1 GDP decline represents the start of what should be a sharp downturn during the first half of this year. Q1 GDP shrank at an 8.2% quarter-over-quarter annualized rate, with consumer spending falling at a 9.0% pace and business investment falling at a 1.4% pace. By industry, services output shrank at a 9.4% rate while industrial output contracted at a 5.7% rate.
The quarterly GDP decline was the largest since the first quarter of 2009. That 2009 record fall is unlikely to last much longer however. A cumulative March and April employment decline of around 3,000,000 people and an almost 30% drop in hours worked has set the economy up for an especially weak Q2, with the consensus expecting GDP to contract at a 41.3% rate.
Global Outlook
China PMIs • Sunday
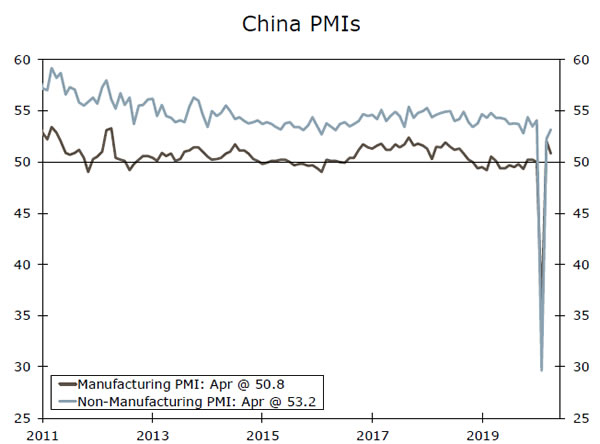
The latest reading on China’s economic recovery from COVID-19 comes next week in the form of the May manufacturing and service sector PMIs. The consensus forecast is that China’s recovery continued into May, with the manufacturing PMI expected to rise to 51.1 and the services PMI expected to rise to 53.5. Importantly, both indices are expected to remain above the breakeven 50 level. Overall, we expect Q2 GDP growth to substantially recoup the Q1 decline. We currently forecast Q2 GDP to rise 8.0% quarter-over-quarter, reversing most the 9.8% fall in Q1.
China is not the only emerging economy to release May PMI figures next week, although PMIs for some other countries should remain at levels consistent with economic contraction. For reference Mexico’s manufacturing PMI was 35.0 in April, while Brazil’s manufacturing and services PMIs were 36.0 and 27.4, respectively.
Previous: 50.8 and 53.2 Consensus: 51.1 and 53.5 (Manufacturing and Services)
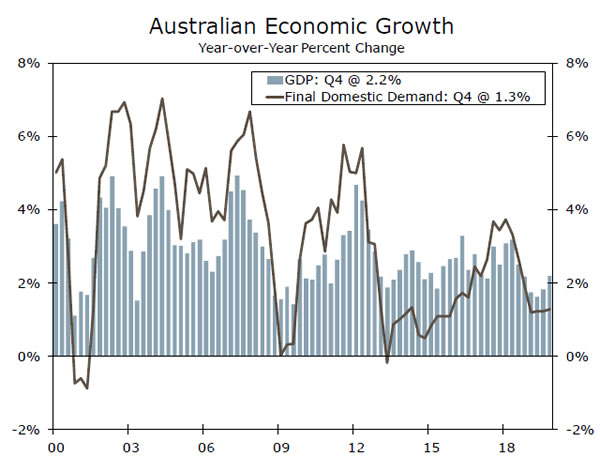
Australia GDP • Wednesday
Australia’s Q1 GDP release next week is likely to reveal slower growth in early 2020, but not necessarily an outright contraction, with COVID-19 related lockdown measures only coming into effect late in the quarter. In fact, a pre-COVID-19 surge in retail sales meant Q1 real sales were up 0.7% quarter-over-quarter, while a rising trade surplus in early 2020 hints at a positive contribution from net exports. Investment spending may however be a weak spot.
After Q4 GDP growth of 0.5% quarter-over-quarter the consensus forecast is for Q1 GDP to fall 0.4%, though we think the risks are tilted to the upside. Meanwhile, the outlook for Q2 GDP is already much more dire, given slumping confidence surveys, as well as massive falls in April employment and preliminary retail sales. Separately, the central bank also announces monetary policy, with the target for the Cash Rate and three-year bond yield both set to remain at 0.25%.
Previous: 0.5% Consensus: -0.4% (Quarter-over-Quarter)
European Central Bank Meeting • Thursday
The European Central Bank (ECB) announces its monetary policy decision next week, at which we expect a further increase in asset purchases. Eurozone economic news has been mixed so far this year, with a large fall in Q1 GDP, April CPI inflation of just 0.1% year-overyear, and large declines in April retail sales and industrial output in prospect.
Recently there have been some encouraging signs, albeit only modestly so. Confidence surveys have improved from their April lows, while Eurozone politicians and policymakers appear to be moving closer to a coordinated regional fiscal response. Still, it will be many months at least before a region-wide fiscal package is agreed and implemented. To keep markets stable in the interim, and to avoid an adverse market reaction by disappointing markets through inaction, we expect the ECB to expand its Pandemic Emergency Purchase Program a further €500 billion at next week’s meeting.
Previous: -0.50% Wells Fargo: -0.50% Consensus: -0.50% (Deposit rate)
Point of View
Interest Rate Watch
What Will the ECB Do Next?
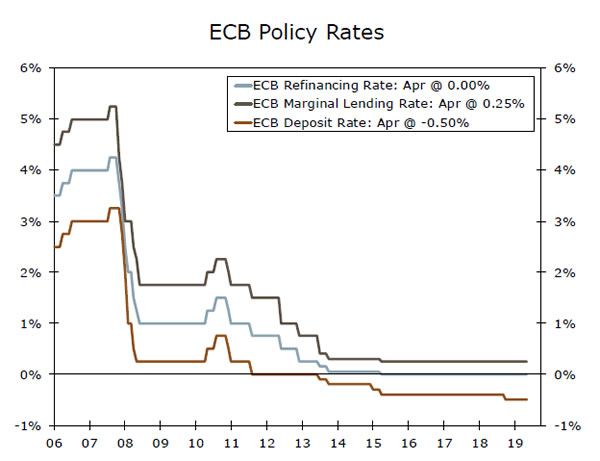
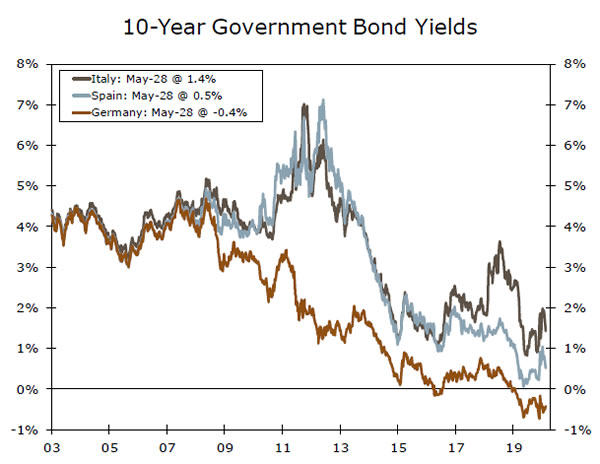
The Governing Council (GC) of the European Central Bank (ECB) holds its next scheduled policy meeting on June 4, but we do not look for it to change any of the ECB’s three main policy rates (top chart). Indeed, we expect that the GC will keep all three policy rates unchanged through at least the end of next year.
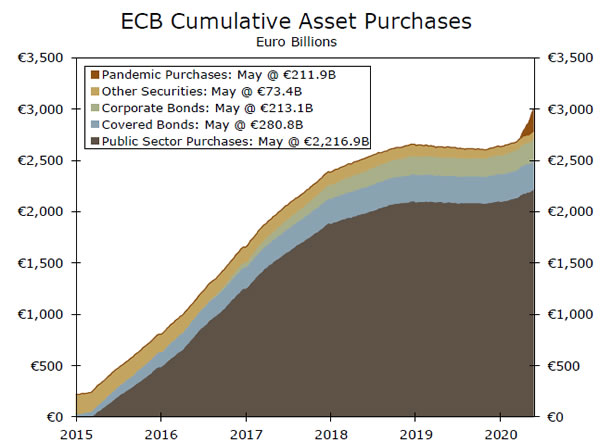
That said, we expect that the GC will announce an increase in the size of its Pandemic Emergency Purchase Program (PEPP) through which the ECB buys public and private sector securities. When the GC announced the creation of the PEPP on March 18, it set the size of the program at €750 billion. The objective was to “counter the serious risks to the monetary policy transmission mechanism and the outlook for euro area posed” by the pandemic.
The PEPP and other measures that the ECB have put in place since March appear to have relaxed tensions in European financial markets. However, it has become apparent that the lockdowns that most individual countries in the euro area have implemented to combat the spread of COVID-19 have had a chilling effect on economic activity in the Eurozone. Indeed, we look for real GDP in the euro area to tumble 8% in 2020. Furthermore, the overall rate of CPI inflation currently stands at only 0.1%, well below the ECB’s target of “below, but close to, 2% over the medium term.” Therefore, expect that the GC will increase the size of the PEPP €500 billion on June 4.
As shown in the bottom chart, the yield on the 10-year German government bond has been in negative territory for over a year. Undoubtedly, previous quantitative easing purchases of German government bonds as well as the PEPP purchases since March have helped to keep their yields at extraordinarily low levels. Yields on Italian and Spanish government bonds have widened relative to their German counterparts since mid-March, but they too remain extraordinarily low in a historical context. Long-term interest rates in the euro area likely will remain extraordinarily low as long as economic activity remains depressed and the ECB continues to buy bonds.
Credit Market Insights
Murky Moment for Mortgages
Interest rates have fallen considerably in the wake of COVID-19. Normally, this would be a boon for homeowners and prospective homebuyers looking to take out a mortgage, but that has not necessarily been the case. For one, mortgage rates have not fallen as much as Treasury yields. After jumping to almost 300 bps in late March, the spread between the 30-year fixed mortgage rate and the 10-year Treasury yield has receded only mildly and remains roughly 80 bps above its average over the past five years. The recent tightness in mortgage lending, however, is perhaps more concerning for those looking to take out a loan. By one measure, the MBA’s Mortgage Credit Availability Index, mortgage lending is the tightest it’s been in six years. While tighter credit standards are to be expected amid the heightened economic uncertainty, the flurry of recent relief programs may be hampering access to credit. For instance, the CARES Act allowed homeowners to suspend payments on federally backed mortgages for up to a year. For mortgage originators, who make the loan and then sell the right to collect the interest payments, rising forbearance makes the right to collect those payments less valuable. Moreover, if borrowers stop making payments, the firms servicing the loan still have to make payments to investors, reducing the incentive to make the initial loan. An already difficult lending environment exacerbated by these factors could dampen the nascent housing market recovery detailed in Topic of the Week.
Topic of the Week
Some Hope for Housing
With much of the economy in free fall, housing has held up relatively well, and many signs point to the sector as a potential bright spot of the eventual recovery. Of course, the housing market has not weathered the ongoing pandemic unscathed. Stay-at-home orders and social distancing have made it difficult to show homes, and made existing homeowners less likely to list. These factors have hit existing home sales particularly hard. Resales fell 17.8% in April, bringing the rate of existing sales to its lowest level since 2011. Pending home sales, which generally lead closings, have fallen precipitously, and suggest sales may be depressed into June, but there are signs that April was the bottom for the housing market. The easing of lockdowns should make it easier to view existing homes and sign documents in person. Traffic of prospective buyers measured in the NAHB/Wells Fargo Housing Market Index increased in May, albeit after a historic decline in April. Meanwhile, new home sales, which appear to have been less impacted by lockdown measures, increased slightly in April. More broadly, demand for housing seems to be back on track.
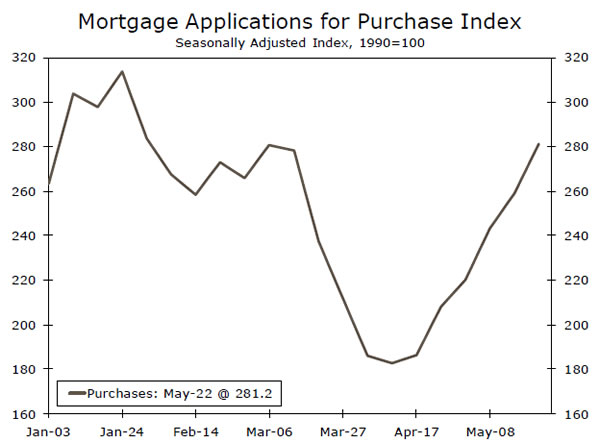
After bottoming in early April, mortgage applications for purchase have quickly recovered their COVID-induced decline and are up 10% year-to-date (top chart). Other high frequency indicators, such as Google searches for ‘new homes’ and Redfin’s homebuyer demand index, also indicate the housing demand has reached or eclipsed its pre-COVID-19 level. While there are some concerns about credit availability (see Credit Market Insights for more detail), mortgage rates remain historically low and should continue to buoy demand.
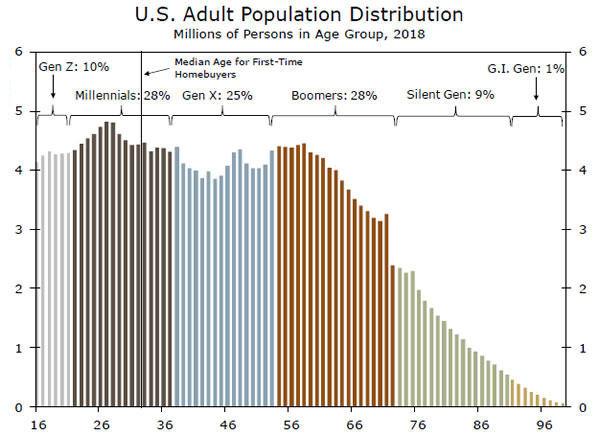
At a time when spending on many big ticket items has fallen off a cliff, it may seem surprising that the urge to buy a home—the single largest purchase many individuals will make—has held up relatively well. But it is important to remember, the housing market had a lot of momentum coming into the year and the underlying drivers remain relatively intact. Prospective homebuyers appear to have escaped much of the labor market carnage thus far and there remains a wave of Millennials entering their home buying years (bottom chart).


