
Market Overview
The dollar remains under pressure amid increased political risk as Donald Trump’s administration goes from bad to worse. Like The Simpson’s Sideshow Bob wandering around a room of upturned garden rakes, there seems to be one self-inflicted wound after another as communications director Anthony Scaramucci has been fired after just ten days in the job. At some stage there will be a tipping point for the markets, at which the nadir in Trump’s chaotic Presidency will be reached. But it does not seem as though that point has been reached quite yet. However whilst there is still some dollar weakness ahead potentially, the Dollar Index is now into a key band of support between 92/93. Will this prove to be an area of viable support? There is arguably open upside on EUR/USD towards $1.2000, whilst Dollar/Yen still has some way to go until its June lows at 108.80. Gold has upside within its range towards $1296, so perhaps there is still some further weakness on the dollar. There needs to be some turnaround in the US data to help counter the political risk. Today we have the ISM Manufacturing and the Fed’s preferred inflation, the core PCE. Recent data releases have only gone to weaken the dollar further. With the drop in the Employment Cost Index and inflationary trends remaining weak, don’t expect any positive surprises today.
Wall Street closed mixed again, with the Dow once more into all-time high ground, whilst the S&P 500 fell -0.1% to 2470. Asian markets were mildly positive overnight with the Nikkei +0.3% whilst European markets are also looking reasonably positive at the open. FTSE 100 outperformed yesterday on HSBC and could again be a leader today with BP beating estimates. In forex, there is a mixed outlook on the dollar, pulling the euro back slightly, whilst the yen continues to perform well. The Reserve Bank of Australia held rates steady at +1.5%, with a warning of the strength of the Aussie holding back inflation and growth. The Aussie is all but flat today. In commodities, gold is mixed, whilst oil continues to push higher, showing mild gains..
The big focus for today will be the Manufacturing PMIs throughout the day but there is also key US inflation to keep an eye on too. The Manufacturing PMIs for Eurozone countries are during the early European session culminating with the Eurozone Manufacturing PMI at 0900BST which is expected to stay at the flash reading of 56.8 (last month 57.4). UK Manufacturing PMI is at 0930BST and is expected to pick up very slightly to 54.4 (from 54.3) after last month’s disappointing decline. Eurozone Q2 GDP is also released at 1000BST and is expected to be +0.6% which is the same as Q1’s upwardly revised +0.6%, and would confirm the Eurozone running at double to growth of the UK. The Federal Reserve’s preferred inflation measure, the core Personal Consumption Expenditure is at 1330BST which is expected to be +0.1% for the month which would be the same as last month’s +1.4% for the YoY data. US ISM Manufacturing PMI is at 1500BST and is expected to drop back to 56.5 from last month’s strong 57.8.
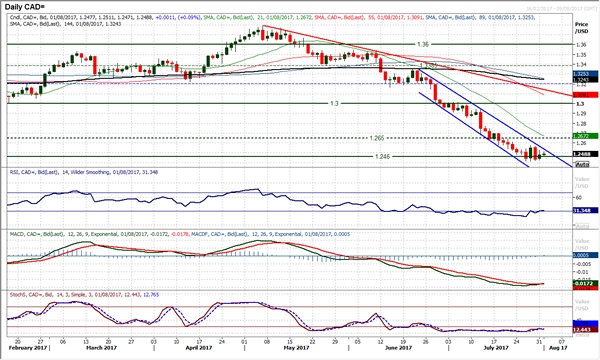
Chart of the Day – USD/CAD
Is a change in trend starting to develop? The market has been in a sharp downtrend channel over the past six weeks in a move that has taken the market from over 1.3200 to consistently pressurising the massive May 2016 low at 1.2458. However, it is interesting to see that in the past few sessions, the volatility has increased with the magnitude of the candles also greater. The old key support around 1.2460 may have been breached but the market is looking to build a low at 1.2412, with each of the past four sessions holding this as a support. The momentum indicators are beginning to tick higher, with the RSI back above 30 (arguably a basic buy signal) and the MACD lines threatening to turn higher. “The trend is your friend until it ends” and calling an early end to a trend can be painful. However the downtrend channel comes in today at 1.2540 and a move above 1.2575 would complete a small base pattern (to imply 160 pips higher). The hourly chart reflects the market turning into a consolidation play and this could begin to impact on the downtrend channel. It will be interesting to see if the downtrend is put under pressure by this consolidation. This could be one to watch in the coming days.

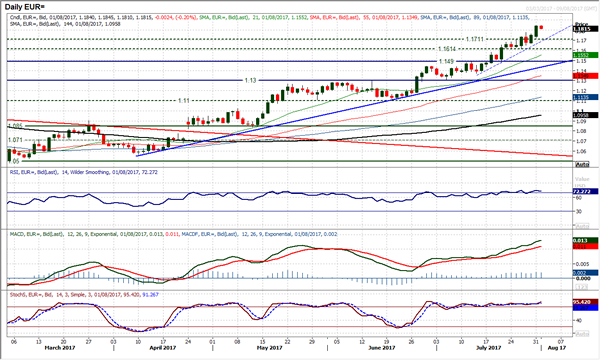
EUR/USD
Another day of weakness on the dollar has sent EUR/USD ever sharply higher. Once more old resistance is seen as being supportive within the uptrend and the latest key breakout at $1.1711 has been used as the springboard for yesterday’s bull candle. The momentum indicators are strongly bullish and there is little to suggest that this run higher will be stopping. There is a tighter uptrend that has now formed in the past three weeks that comes in today at $1.1690, however even intraday corrections are seen as a chance to buy. At some stage it is perfectly possible that a profit-taking correction will take hold, but for now stick with the bull run. There is little real resistance until over $1.2000. The hourly chart shows positive configuration and any dips this morning are a chance to buy. Initial support $1.1725/$1.1775, with $1.1611 now key.
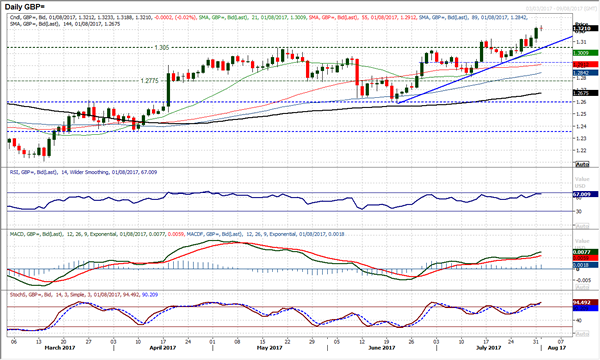
GBP/USD
With a second consecutive strong bull candle the market has now pulled away and deep into the next phase of a trading band broadly between $1.2800/$1.3500 that came from June/September 2016. The market also continues to bolster the six week uptrend which is now supportive at $1.3045. Momentum indicators remain strongly configured with the RSI rising in the high 60s, MACD lines accelerating higher in positive territory and the Stochastics strong. Corrections remain a chance to buy with the band of support now up to $1.3050/$1.3125. The hourly chart shows the market looking strongly configured and any intraday weakness towards $1.3160/$1.3175 is a chance to buy. The daily chart shows little real resistance of any significance until the $1.3445/$1.3480 highs of Q3 2016 but there is a minor resistance at $1.3345.
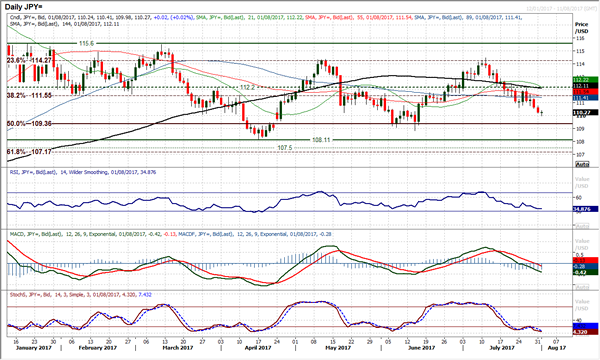
USD/JPY
Another solidly negative candlestick has confirmed the breach of the previous support at 110.60, with the market now well on the way towards a test of the 50% Fib leel at 109.35 and the June low at 108.80. Momentum indicators are increasingly negative with the RSI now down to the mid-30s (but with further downside potential) and the MACD lines falling below neutral. A feature of this run lower over the last few weeks has been that strong candles have often been followed by long legged dojis (or at least very small bodies) as intraday rallies have consistently been sold into. After two solid negative sessions, the potential is for another rebound, but that would again be a chance to sell. The intraday chart shows a downtrend of the past four sessions an if this is broken to the upside then a rally could set in. There is overhead resistance piling up between 110.60/110.80 initially and then all the way to 111.30 and 111.70. Do not expect a rally to get far before the sellers return.
Gold
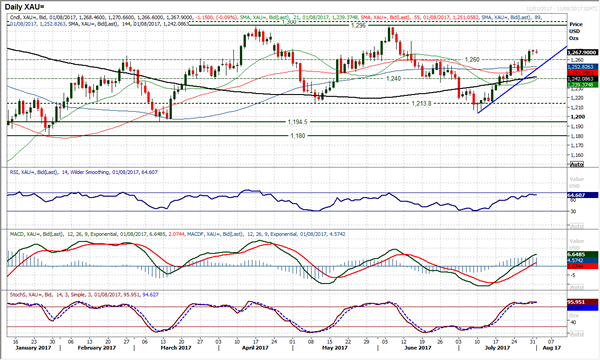
Despite the dollar weakness that flooded through forex markets yesterday, there was a degree of consolidation on gold yesterday. The bulls just seem to have taken a brief pause for breath and look ready to once more resume the rally higher. The breakout above $1260 has re-opened the highs once more at $1296. With the strength of the momentum indicators there is consistent buying into weakness now. The old pivot at $1260 now becomes supportive for near term corrections, whilst the uptrend comes in today at $1250. This means that any support between $1250/$1260 looks like a good chance to buy now. There is minor resistance at $1279.40. The hourly chart shows that yet another breakout old resistance is becoming supportive, with $1265 building in the past day.
WTI Oil
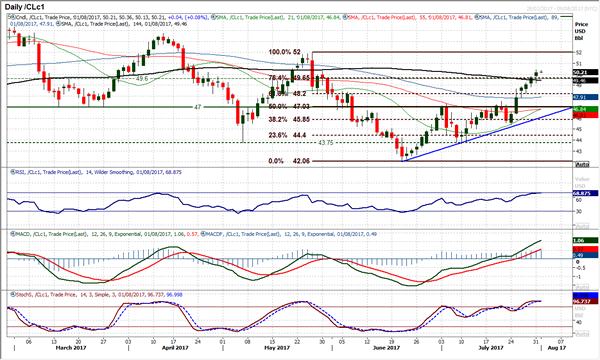
The bulls are not giving up quite yet. Although it had looked early in the session that the steam was coming out of the rally, there is still an appetite to buy into weakness, even on an intraday level. Momentum indicators remain strong and as yet there is still no real profit-taking signal, with corrections remaining a chance to buy. The sequence of higher daily lows means that there is now $49.20 to add to previous session lows at $48.85 and $48.25. Momentum indicators remains strongly configured with the RSI pushing towards 70 and MACD lines accelerating higher. The $50 psychological barrier has been broken and there is little real resistance until the $52 May high. The hourly chart shows that any unwinding of bull momentum is consistently being bought into.
Dow Jones Industrial Average
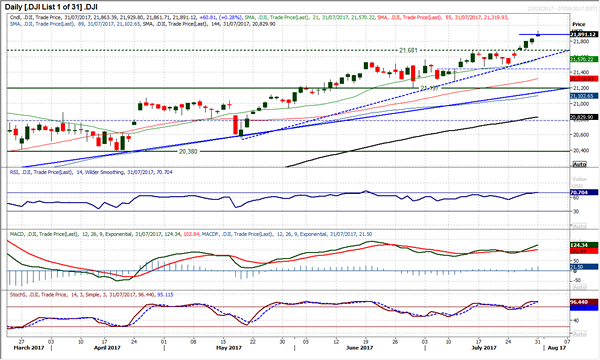
It has taken less than a handful of sessions for the Dow to hit the implied 210 tick breakout target (it was after all just about a percent higher). The bulls still remain in control as the market pushes ever higher. The momentum indicators remain strong but there is a sense that the market having hit the near term breakout target and the RSI now over 70, there could become to be a limit to the immediate further upside. The last time the RSI started to turn lower from above 70, the market corrected back by over 300 ticks from 21,529 to 21,197 in mid-June. Therefore, watch for the RSI beginning to roll over back below 70. There is a gap at 21,841 that needs to be at least filled and if this gap is closed, this could also be an initial profit taking signal. The hourly chart looks strong with key initial support at the latest breakout of 21,681.


 Is Testing an Important Resistance Zone")

