
U.S. Highlights
- Job growth slowed in April, with just 266k jobs created in the month. With a growing labor force, the unemployment rate edged up to 6.1% from 6.0% in March.
- ISM manufacturing and services indexes also pointed to slower growth in April, but price sub-indexes continued to accelerate. Supply-chain constraints are widely reported across manufacturing and services industries.
Canadian Highlights
- The Canadian dollar advanced further this week, approaching 82 U.S. cents, the highest since 2017. Alongside other drivers supporting the loonie, commodity prices continued to move higher.
- Canada lost 207K jobs in April as restrictions were tightened in its largest provinces during the month. Hours worked fell 2.7% on the month, pointing to a possible drop in monthly real GDP.
Special Feature – Tracking Progress Toward U.S. Employment
- With the April jobs report in hand, we can take stock of how far we’ve come and how far we still have to go.
- Looking across a range of indicators, even maintaining the recent (admittedly disappointing) rate of improvement, the labor market will approach maximum employment over the next two years.
U.S. – Job Growth Slows in April as Signs of Supply Constraints Build
It’s jobs week! This morning, the U.S. Bureau of Labor Statistics surprised the market with the payroll survey reading of only 266 thousand jobs created in April, well below the one million anticipated by forecasters. Net of revisions, employment was down 78 thousand compared to the previous report. The unemployment rate edged up a tenth of a percentage point to 6.1%, while the labor force participation rate increased to 61.7% from 61.5%. Notably, leisure and hospitality sector added 331 thousand jobs – a small consolation to an overall disappointing report.
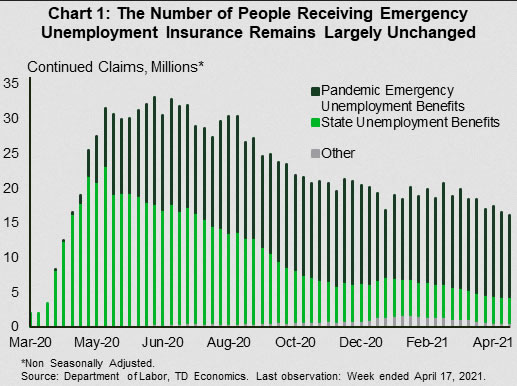
Today’s report reiterates the fact that the labor market still has a long way to go and the path to full employment is not as straight forward as hoped. Another reminder of this was this week’s weekly jobless claims report, which dropped for the fourth consecutive week even as the number of people receiving pandemic emergency unemployment benefits showed little movement (Chart 1). This could reflect a COVID-induced hesitancy towards returning to work as long as the virus is still spreading, as well as parts of the economy remaining closed.
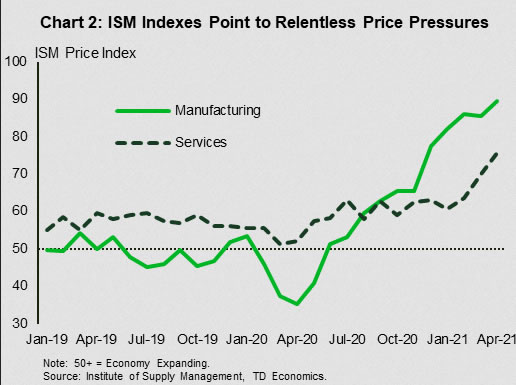
Emergency unemployment benefits will expire in September and by then, with a large portion of people vaccinated, the health crisis should largely be in the rear-view mirror. This should help to alleviate some of the potential labor supply issues. In the meantime, higher payroll costs appear to be adding to production prices. This week’s ISM reports reiterated the point. While both the manufacturing and service sector indexes are expanding, they slowed in May. At the same time, the price sub-indexes of both industries continued to accelerate, as supply-side bottlenecks interrupted business activity (Chart 2). Surging demand combined with constrained supply could allow businesses to start passing on the added costs to consumers, though this remains to be seen in the consumer price data. In the meantime, the impact of supply chain dislocations is likely to continue.
The Federal Reserve will look past one time jumps in prices, but will be cognizant of the risk of faster price growth becoming imbedded in expectations. While a wage-price spiral is unlikely and the Fed will temporarily look past inflation running above its 2% target, it will not do so forever. As long as the economic recovery picks up as we expect it to, rate increases will occur before the Fed’s median dot suggests (our recent rate forecast calls for the first hike in late 2022).
Market reaction to a change in Fed communication is likely to be felt across asset classes and will have consequences for financial stability. A “sharp rise in interest rates” was the second most cited potential shock noted in the Fed’s Financial Stability Report, which also mentions stretched asset valuations as one of the major vulnerabilities to the financial system.
Canada – The Tug of War Continues
After moving sideways earlier on possible rate hike remarks south of the border, financial markets are closing the week in positive territory. The S&P/TSX composite is following its global peers higher, recording a 1.8% gain in the week (as of writing). Meanwhile, the Canadian dollar continued its uptrend, reaching 82 U.S. cents this week, the highest since the fall of 2017. The loonie has been supported by a confluence of factors, including a broader risk-on tone, a weak USD, and rising commodity prices. To this end, lumber continues to break record highs, with copper following suit this week, reaching US$4.7 per pound.
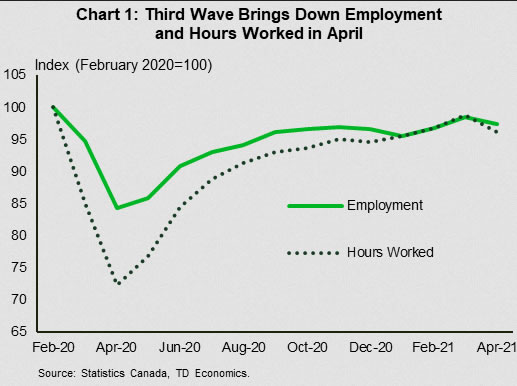
In terms of economic data, April’s Labour Force Survey (LFS) release took center stage this week (Chart 1). The tug of war between infections and vaccinations continues to dictate Canada’s economic trajectory. Employment tumbled by 207K jobs –worse than consensus expectations for a 162.5K decline. There was little in the way of optimism in the report. Indeed, hours worked fell 2.7% on the month, pointing to a decline in monthly real GDP. Job losses were relatively broad-based, extending to seven of 10 provinces and 11 of 16 industries. Ontario and B.C. saw the steepest declines. Both provinces re-enacted restrictions on the service sector in response to rising cases in April, with Ontario still under a stay-at-home order.
The K-shaped nature of the recovery was once again on full display. As expected, the close-contact services industries are again bearing the brunt of the losses. Retail/wholesale trade (-89K) and the accommodation/food services (-59K) industries were the largest contributors to April’s job losses. Meanwhile, gains were recorded in the professional services, public administration, and financial service industries.
Although losses are expected to have peaked, a return to meaningful job growth is not be expected before June. Most provinces have stayed the course on restrictions in recent weeks. In fact, Alberta increased its restrictions this week in response to still-rising caseloads.
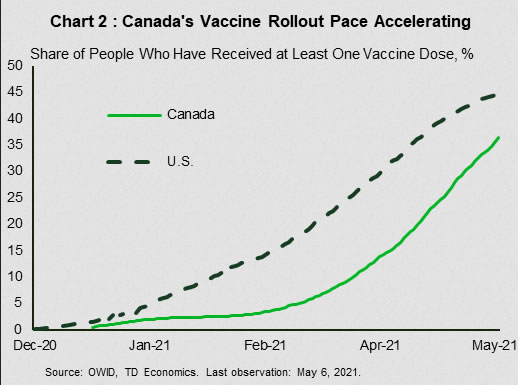
Still, sunnier days are ahead. Caseloads have been declining in most provinces. Importantly, Canada’s vaccine administration has received a major boost in recent weeks (Chart 2) – with the percentage of the population receiving a first dose quickly approaching the level in the United States. Second dose administration still lags but shipments are ramping up, and some provinces have issued guidance that the majority of adults may receive their first dose this month. In that vein, provinces are starting to release vaccine-driven reopening plans. Saskatchewan was the first to release a plan this week, with its three-step strategy pointing to a gradual easing of restrictions in May. Quebec is reportedly expected to follow.
In contrast to previous waves of infection, a return to some semblance of normalcy appears in sight this time around. All told, despite April’s downbeat LFS report and unfortunate job losses, we are still cautiously optimistic on Canada’s economic recovery going forward, which has proved resilient in recent months.
Special Feature – How Far is the U.S. Labor Market from Home?
At his press conference last week, Federal Reserve Chair Jay Powell repeated the mantra that “the economy is a long way from our goals, and it is likely to take some time for substantial further progress to be achieved.” The disappointing rate of job growth in April seems to echo Powell’s statement. Still, there has been improvement from the initial sudden stop in activity a month and a year ago. With the jobs report in hand, it is worth taking stock of how far we’ve come and how long it might take to reach those goals against a range of labor market indicators.
Well before Powell’s statement, the Fed had made changes to its characterization of its goals. In August 2020, the Federal Reserve updated its long run strategy document to take a more inclusive view of progress in the labor market toward “full employment.” The Fed pledged to concern itself more with “shortfalls” from maximum employment than “deviations” from it. In other words, it will not be as concerned with unemployment running below its longer-run goal as moving above it.
The Fed also reduced emphasis on the unemployment rate as its sole measure of “maximum employment” and has increasingly pointed to a wider range of indicators. The Fed has not endorsed an official list of indicators, but Fed governors have pointed to the employment-to-population ratio, labor force participation, and gaps in employment rates and wage rates between different segments of the population. A broader list of indicators and their progress to-date is included in Table 1.
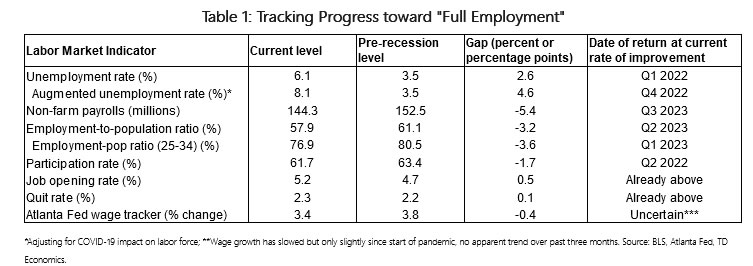
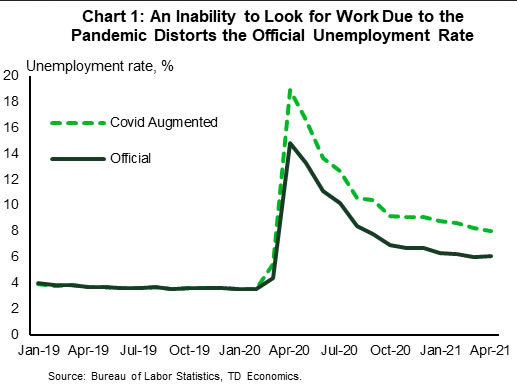
There is especially good reason to look past the unemployment rate in the current pandemic environment. The inability of many people to look for work due to the health crisis itself has resulted in a decline in the labor force that has distorted the official unemployment rate, making it less comparable to history. So, while the official measured unemployment rate edged up to 6.1% in April, removing the pandemic effect would push it to 8.1% (Chart 1). This is a measurable difference. Following the Great Recession, it took three years for the unemployment rate to move down two percentage points. Still progress is being made. At the rate of improvement over the past three months, it will take until the fourth quarter of 2022 for this “augmented” rate to hit pre-recession level of 3.5%. We expect job growth to pick up in the months ahead, potentially moving this target forward.
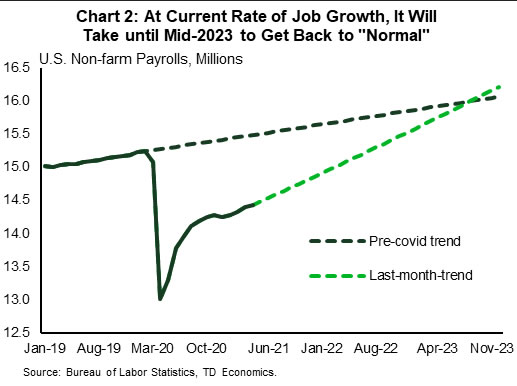
A simpler measure to gauge the health of the labor market is just look at the overall level of employment. With the 266k jobs created in April, total U.S. employment is 8.2 million (5.4%) below its pre-recession peak. However, had it not been for the health crisis, jobs would have kept growing through this period. This is the ‘counterfactual world’ of jobs returning to what should have been, versus what was. This counterfactual outcome suggests the employment shortfall is larger at 6.8%. Job growth is likely to pick up speed, but at the rate of improvement over the past three months, the two lines will not cross until the third quarter of 2023 (Chart 2).
As noted above, the labor force participation rate has been directly impacted by the downturn. Encouragingly, the participation rate rose in April (up 0.2 percentage points). Still, after falling 3.2 percentage points (pp) during initial lockdown, it has recovered only 1.5 pp to-date. While population aging makes determining the trend in labor force participation more difficult, it was rising prior to the pandemic. Simply moving age-specific participation rates back to their pre-crisis levels at the current rate, it will take until the second quarter of 2022 to get back to normal on this metric.
Another commonly cited measure that avoids the labor force participation rate is the employment-to-population ratio. This reached a recent high of 61.1% in February 2020 and currently sits at 57.9%. It has come a long way from its trough of 51.3% last April. However, should the recent rate of improvement persist it will take until the third quarter of 2023 to retake its pre-recession level.
The employment-to-population ratio also has its shortcomings. As with the participation rate, population aging tends to put downward pressure on the aggregate level. To correct for this, economists home in on the employment ratio for people in their prime working years, between the ages of 25 to 54. Prior to the pandemic, this reached a high of 80.5% of the population. In April it rose to 76.9%. At the recent rate of improvement, it will regain its pre-recession level in the second quarter of 2023.
Two metrics that have not been impacted by the recession are the level of job openings and quits. The job opening rate in February (the data is lagged a few months), was 5.2%, above its pre-recession peak of 4.7%. The level of quits is also slightly higher than its pre-recession level at 2.3% compared to 2.2% prior to the pandemic. An inability to find workers is also a symptom of the health crisis and, in addition to showing up in the openings and quits data, may also be contributing to higher wage growth. Even without shortages, the aggregate wage data has been distorted by the disproportionate negative impact on jobs at the lower end of the wage spectrum, especially during the initial lockdown. This impact, however, appears to have largely fallen out of the data. Even with strong monthly wage growth in April (+0.7%), year-on-year wage growth fell to 0.3% in April, from 4.3% in March.
A better indicator that compares wage growth for the same pool of workers is the Atlanta Fed Wage Tracker. It was up 3.4% year-on-year in the latest month – down slightly from its pre-recession level of 3.8%. This speaks to the unique nature of the push-pull impact of this recession. Little change in overall wage growth despite massive changes in jobs, implies constraints on both sides of the supply and demand equation.
Putting it all together, the job market is still not where the Fed would like it to be, but looking across a range of indicators, even maintaining the current (admittedly disappointing) rate of improvement, it is still likely to get there over the next two years. However, as shown in strong job openings, quits and wages, supply may be just as much of an issue as demand. This will not last forever, and as the health crisis passes and policy normalizes, we expect to see an improvement in both, speeding up the labor market recovery from its pace so far this year.


