
U.S. Highlights
- US retail sales rose by 0.9% m/m, while the control group grew by a stronger 1% m/m. Revisions to the month prior were also positive, suggesting Q1 spending ended the quarter on a firmer footing.
- Home sales fell by 2.6% m/m to 5.6M units in April, as deteriorating affordability continues to weigh on demand. Housing starts (-0.2% m/m) also recorded a modest decline but remain at a healthy 1.7M units.
Canadian Highlights
- Canadian inflation topped 6.8% year-on-year, with prices for food and housing lifting the headline figure.
- Housing markets showed a softening in demand in April, as sales and prices both fell. This brought the sales-to-listing ratio closer to a balanced market. Future supply is likely to improve the balance further, with starts rising 8% on the month.
Global Highlights
- Inflation continued to accelerate across the G-7 into April as the effects of rising food and energy prices continue to be felt.
- Moving forward, higher interest rates and reduced real disposable incomes will weigh on demand and help to cool inflation by narrowing the wedge between demand and supply.
Recent TD Economics Research
U.S. – Spending Through the Pain
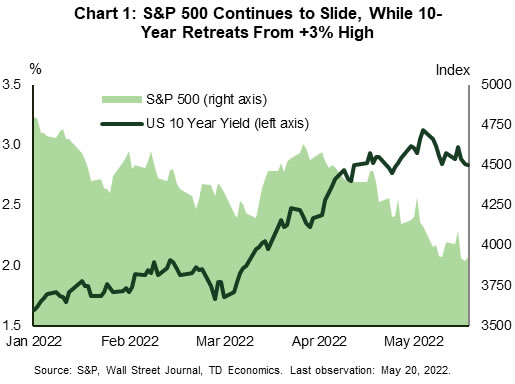
US equities extended one of their worst losing streaks since 2008 this week, having now recorded seven consecutive weeks of declines. At the time of writing, the S&P 500 is down 2% on the week, and a far greater 18% year-to-date. The selloff in stocks fueled a rally in US treasuries, pushing the 10-year yield down by 10 basis points to 2.83% (Chart 1).
Sentiment soured early in the week as U.S. brick-and-mortar retailers drastically cut future earnings expectations. The common theme was that they are struggling with higher inflation, wages pressures and rising freight costs, all of which are cutting into profits. The dour reaction from financial markets appears to be rooted in the growing concern that the US economy is on the verge of a recession. Investors interpreted the disappointing earnings as a sign that consumers are already on a more precarious footing, further fanning the recession rhetoric. We see things a bit differently.
For starters, many of these big box retailers operate in an environment where margins have always been relatively thin. Even in “normal times”, their ability to pass-on higher costs to consumers is quite limited given the competitive nature of the retail landscape. This problem has been heightened of late, as retailers moved to replenish severely depleted inventories late last year even as consumer demand was already pivoting from goods in favor of services. Retailers were left holding significant inventory, forcing them to discount some merchandise, cutting further into profits.
Retail sales data for April corroborate the notion that consumer spending remains healthy. Headline sales were up 0.9% month-on-month (m/m), while the control measure was up an even stronger 1% m/m. Removing the effects of inflation from the control group did little to change the story, as real sales rose by a healthy 0.9% m/m. Revisions to the prior month were also positive, suggesting consumer expenditures ended last quarter on a much firmer footing than previously thought. While spending is expected to remain robust over the near-term, the combination of higher interest rates and persistent inflationary pressures will present a material headwind in the second half of this year and into 2023. Spending is expected to moderate to a sub-2% pace, though remain supportive of underlying economic growth.
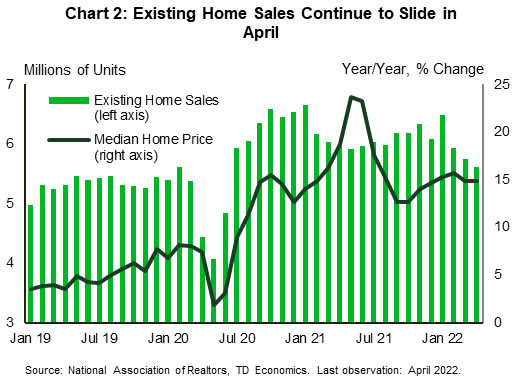
Outside of consumer spending, higher interest rates continue to weigh on housing demand. Existing home sales fell for the third consecutive month in April, falling by 2.4% m/m to 5.6M units (Chart 2). Inventory remained incredibly tight, though the pullback in sales did allow supply to nudge a touch higher to 2.2 months – from 2 months in March. Even still, the market remains undersupplied, which is helping to sustain double-digit price growth of 14.8% y/y.
Housing supply relief is coming, but it is taking longer than expected to come to market. Despite recording a modest pullback in April, housing starts remained at a healthy 1.7 million units, while permitting activity continues to point to further gains in construction activity in the months ahead. The combination of softening demand and increased supply should go a long way in rebalancing the market over the coming months, and better align price growth to underlying fundamentals.
Canada – Inflation Heats Up, While Housing Cools
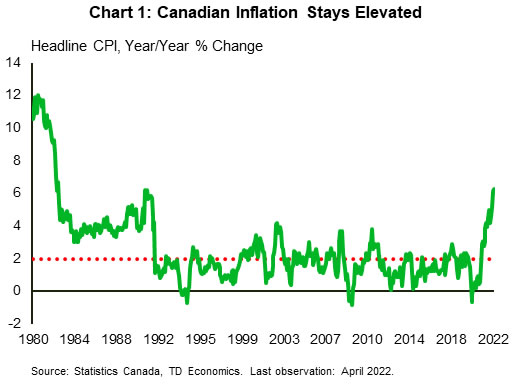
It was a week full of headline grabbing economic data releases, with inflation and housing statistics stealing the show. Consumer prices came in at 6.8% year-on-year (y/y) in April, driven by the two biggest inflation categories, food and shelter. Food purchased at grocery stores continued to advance, up 9.7% y/y, the highest rate in over 40 years. On the shelter side, costs rose 7.4% y/y, led by a significant upturn in the cost of maintaining existing homes and buying new ones. The combination of higher food and shelter costs contributed to over half of the total inflation print.
Furthermore, we are seeing a broadening of inflation, with high price growth now showing up in services. While goods inflation is still running at over 9%, the return to more in-person activities in Canada has services inflation starting to ramp-up at 4.6% y/y (vs 3.5% in December). This has the average of the Bank of Canada’s three core inflation metrics rising to an uncomfortable high of 4.2%.
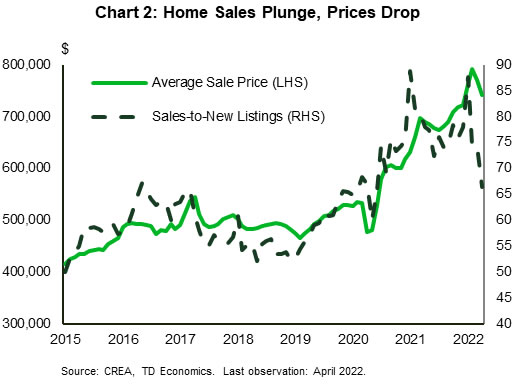
Given the large weight that shelter holds in the CPI basket, the outlook for inflation will be greatly influenced by the path of Canadian housing. This week we received a first look at the impact of higher interest rates on this closely watched sector. In the month of April, housing sales declined 12.6% month-over-month (m/m), falling by 47.2k units – the lowest level of activity since May 2020. The decline was broad, with eight of ten provinces seeing a slowdown. Most notable was the 21% drop in Ontario, followed by 12% and 10% drops in BC and Alberta, respectively. With national new listings declining by only 2%, the sales-to-new listings ratio fell to 66.5%, from 74.4% in March.
Waning demand and move to a more balanced market caused the average home price to decline 3.8% m/m. Ontario was a standout, with prices falling 6.3% on the month. This caused the Canadian average price growth in y/y terms to ease to a more reasonable 7.5%. There is clearly a reset happening in the minds of Canadians. Home buyers have gone from a mentality of needing to buy now before prices go up further, to sitting on the sidelines as they wait to see how much lower prices can go.
With the demand for housing having quickly evaporated in the last two months, the hope is that this does not curtail the push to increase housing supply. We received encouraging data on this, as housing starts rose 8% in April (at 267k unit), continuing a strong trend in building activity. Most of this was driven by the 14% gain in the multi-family category, compared to the 1% increase in single-detached starts. Even with the increase in building activity, the market is still undersupplied, with inventories having failed to keep up with demand for years. This should support housing starts going forward, even as resale demand readjusts to the new higher interest rate environment.
Global – Energy Prices Eat into Buying Power
It’s inflation week in the G-7 as the European Union, the U.K., Canada, and Japan all released detailed April inflation numbers. The U.K. made headlines as the consumer price index (CPI) measure reached an eye-watering 9.0% year-over-year (y/y) – the broader measure that includes home ownership services advanced by a more modest 7.8%. Even in Japan inflation hit a seven and a half year high as headline CPI growth reached 2.5%. In general, the surge in energy prices is the rising tide that is lifting the cost of living at a multi-decade high pace.
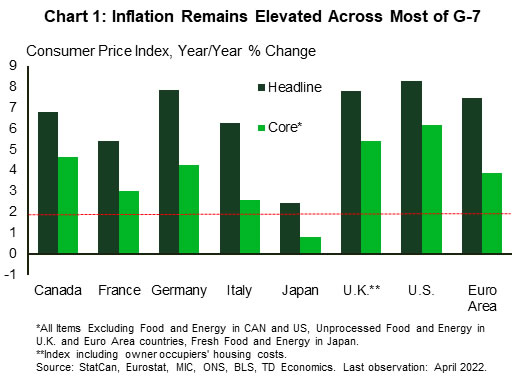
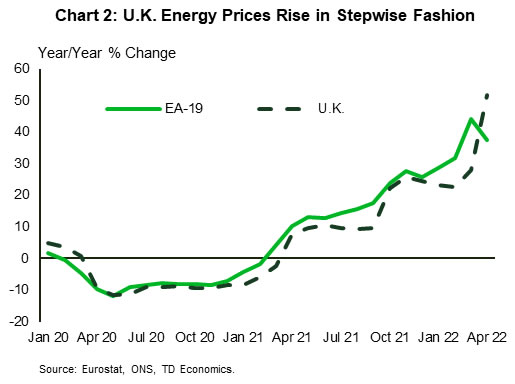
Headline CPI for April in the euro area was 7.3% y/y, while the measure excluding food and energy moved to 3.8%. By comparison, the U.S. registered 8.3% headline and 6.2% core advances, while Canada’s release this week showed a 6.8 % and 4.6% increase (Chart 1). The magnitude of the energy shock Europe is witnessing now can’t be understated. Energy prices are up 37.5% y/y, 7.3 percentage points ahead of the U.S. and a whopping 11.1 percentage points more than Canada. In the U.K., April saw the semi-annual adjustment to price caps on retail energy products. The cap increase produces abrupt jumps in energy costs followed by relative lulls (like a staircase) that ultimately tracks with the smoother European price profile (Chart 2).
That said, core measures (excluding food and energy) of inflation in most of the G-7 countries are well ahead of policymakers’ targets. This reflects demand continuing to outstrip supply as the global economy reckons with a sequence of supply-side shocks.
As inflation continues to accelerate central bankers are concerned about longer-term inflation expectations rising and the entrenchment of a wage-price spiral. That’s a key part of the reason why they continue to signal more monetary tightening despite the risk of a slowdown in growth.
Higher interest rates will work to weaken demand growth, albeit with a lag. The effect of inflation on purchasing power will be more immediate. Measures of wages in the U.K. and Europe are not keeping up with inflation. Average weekly earnings in the U.K. (adjusting for purchasing power) are up 3.5% y/y but, when bonuses are excluded, underlying real wages are down 2.0%. Euro area measures are released with a significant lag, but collectively bargained pay in Germany and Italy (which generally track underlying wage growth) are also lagging inflation. Notably, real hourly contractual wages in Japan were up 1.3% in March. However, in general, wage growth is not keeping up with inflation, so consumers will either be tapping accumulated savings or scaling back on purchases.
Moving forward, output growth will slow through the latter half of the year as inflation and higher interest rates erode purchasing power and slow expenditures. The softer demand backdrop will also help to cool inflation as the wedge between demand and supply narrows.


