
According to Friday’s data, in the US:
→ the unemployment rate rose to 3.9% (expected = 3.8%). The last time the level was this high was in February 2022.
→ the number of workers employed in the non-agricultural sector increased over the month by only 150k (+178k expected). The last time the figure was below 150k was in February 2021.
Published negative data clearly indicate a cooling of the labour market. Why then did the E-mini S&P-500 futures price end the week up about 5.5%, marking the best week of 2023?
The point is that market participants are increasingly convinced that the Fed will no longer tighten monetary policy. That is, interest rates have peaked, the next step should be to ease them, which will allow companies to grow.
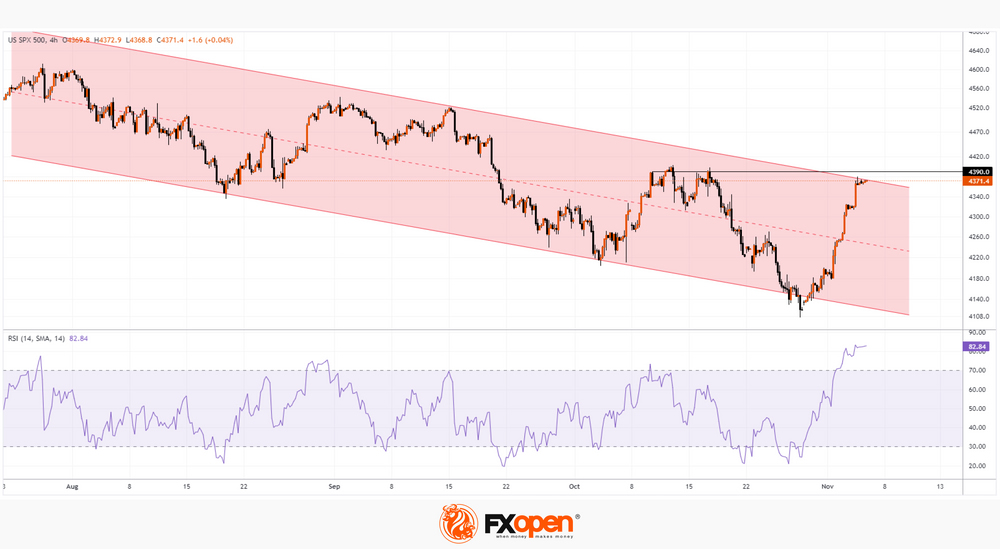
The 4-hour chart of the S&P 500 shows that the index price:
→ has reached the upper border of the descending channel, above which there is a resistance line from the October highs;
→ the RSI indicates severe overbought.
That is, the market is in a vulnerable position for the formation of a rollback from current price levels. If the price goes into a pullback, it will be an important test for the current positive interpretations of statistical data — is rising unemployment really a good thing for the stock market?
This article represents the opinion of the Companies operating under the FXOpen brand only. It is not to be construed as an offer, solicitation, or recommendation with respect to products and services provided by the Companies operating under the FXOpen brand, nor is it to be considered financial advice.


