
- Gold remains in trading range in short-term
- Price rebounds off 1,984
- MACD and RSI suggest buying interest
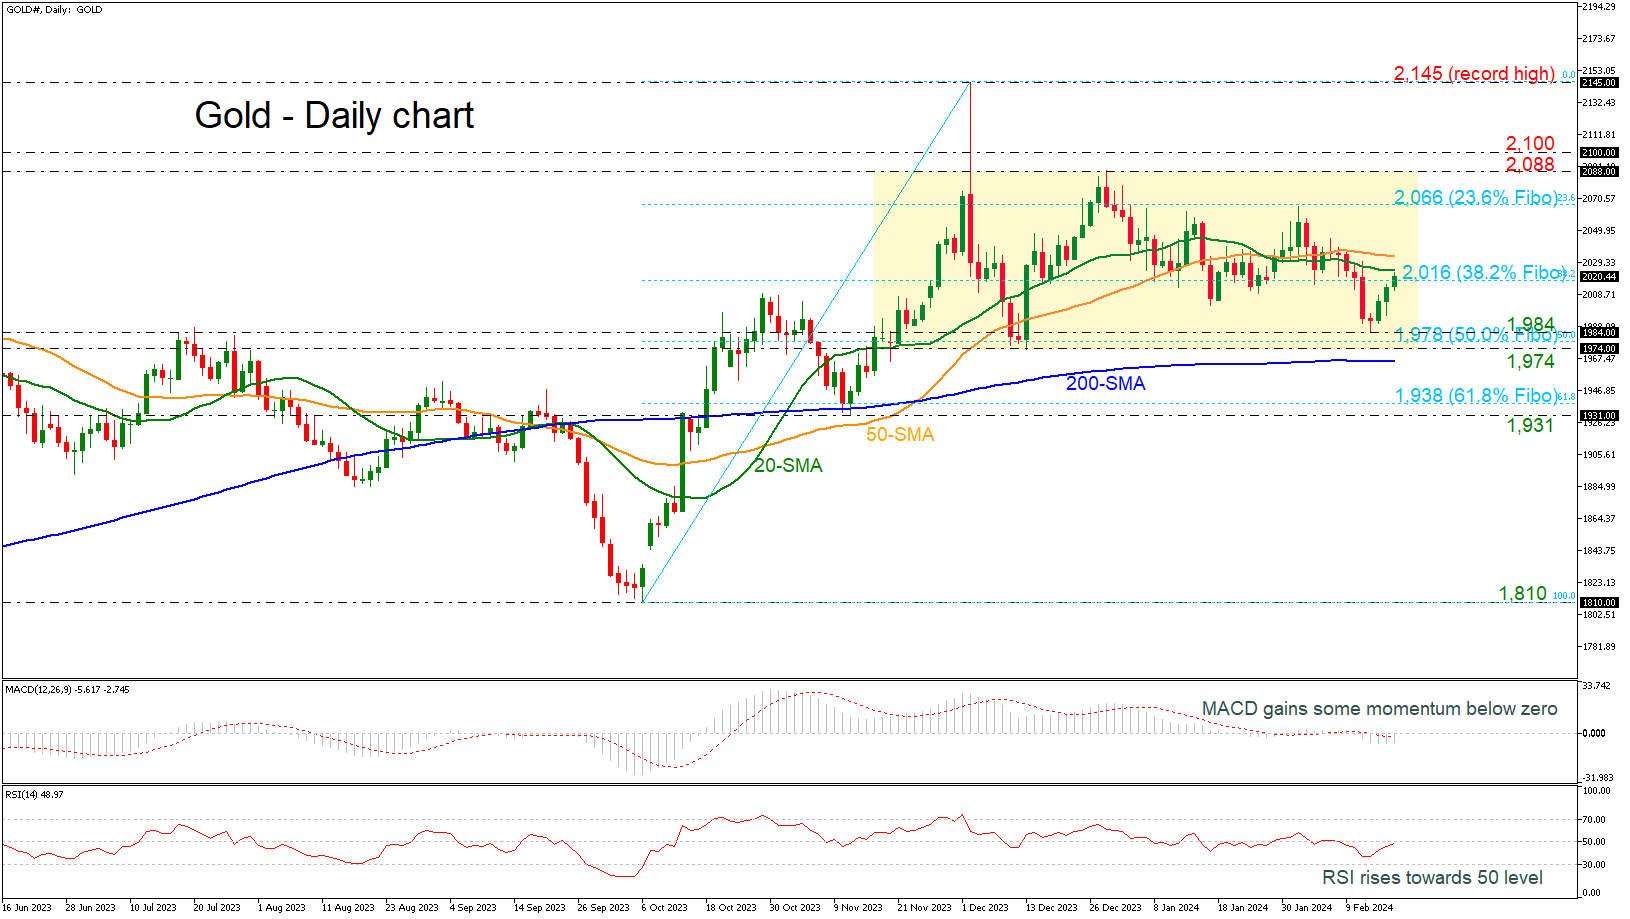
Gold is moving higher again today, recording its third consecutive green candle after bouncing off the 1,984 support level. It is currently testing the 38.2% Fibonacci retracement level of the up leg from 1,810 to 2,145 at 2,016 and the 20-day simple moving average (SMA) at 2,024.
The market has been developing within a consolidation area over the last three months and continues to do so, with the technical oscillators suggesting an upside recovery. The MACD is gaining some momentum beneath its trigger and zero lines, while the RSI is moving higher towards the neutral threshold of 50.
In the event the pair re-activates its upward move above the 20- and the 50-day SMAs, the next target will be the 23.6% Fibonacci of 2,066. Even higher, the bulls might head for the 2,088-2,100 restrictive region, which is also the upper boundary of the trading range. A successful break above this zone could endorse the bullish movement until the record peak of 2,145.
On the downside, the 1,984 support level has been guarding selling forces over the past two days. Hence, a step beneath that line at the 50.0% Fibonacci of 1,978 and the 1,974 barrier might produce fresh negative volatility, likely squeezing the price towards the 200-day SMA at 1,965. Another defeat there could add more fuel to the bearish wave, bringing the 61.8% Fibonacci of 1,938 immediately under the spotlight.
Overall, gold is sustaining an upward move but in order to attract new buyers, the commodity will need to pierce through the 2,088-2,100 bar.


 Is Testing an Important Resistance Zone")


%20at%202,024.)