
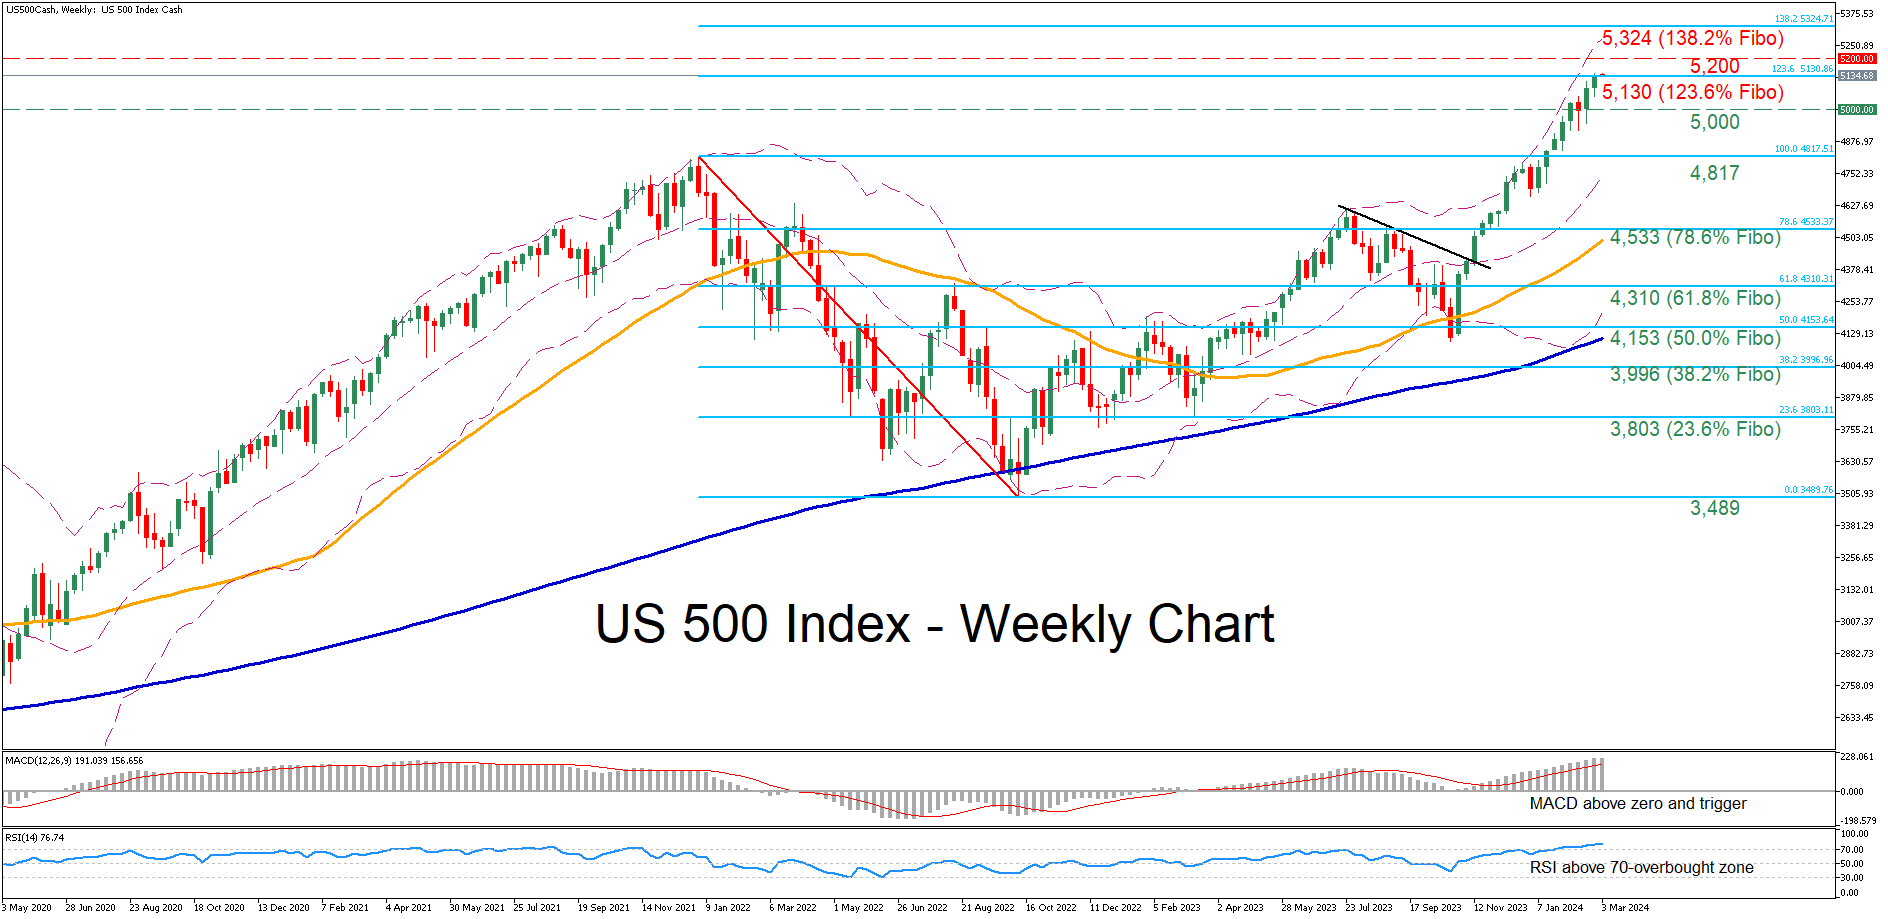
- US 500 cash index extends its series of record highs
- Tests 123.6% Fibonacci extension of its 2022 downtrend
- Oscillators look overbought, increasing risk of a pullback
The US 500 stock index (cash) has been staging an impressive rally since it bottomed out in October 2023, generating consecutive all-time highs. Given that the price is trading into uncharted waters, the Fibonacci extensions of its most recent downtrend could provide potential future resistance zones.
Should bullish pressures persist, buyers might initially claim 5,130, which is the 123.6% Fibonacci extension of the 4,817-3,489 downtrend. Surpassing that zone, the price could storm towards the 5,200 round number. Further advances could then cease around the 138.2% Fibo of 5,324.
On the flipside, if the index experiences a pullback, the 5,000 psychological level could act as the first line of defence. Should that barricade fail, the bears could attack the 2021 peak of 4,817, which could serve as support in the future. Failing to halt there, the price may challenge the 78.6% Fibo of 4,533.
Overall, the US 500 index has been facing persistent upside pressures, which have resulted in consecutive all-time highs in 2024. However, the price could soon experience a pullback as the momentum indicators are flagging extremely overbought signals.


%20has%20been%20staging%20an%20impressive%20rally%20since%20it%20bottomed%20out%20in%20October%202023,%20generating%20consecutive%20all-time%20highs.%20Given%20that%20the%20price%20is%20trading%20into%20uncharted%20waters,%20the%20Fibonacci%20extensions%20of%20its%20most%20recent%20downtrend%20could%20provide%20potential%20future%20resistance%20zones.)