
Part III: Where Is Stagflation Headed from Here?
Summary
- In the first installment of this series, we presented a simple framework to characterize stagflation and identified 13 instances in the United States since 1950. We briefly summarized past episodes of stagflation in the second installment. In this final report, we consider the risk of stagflation in the coming years.
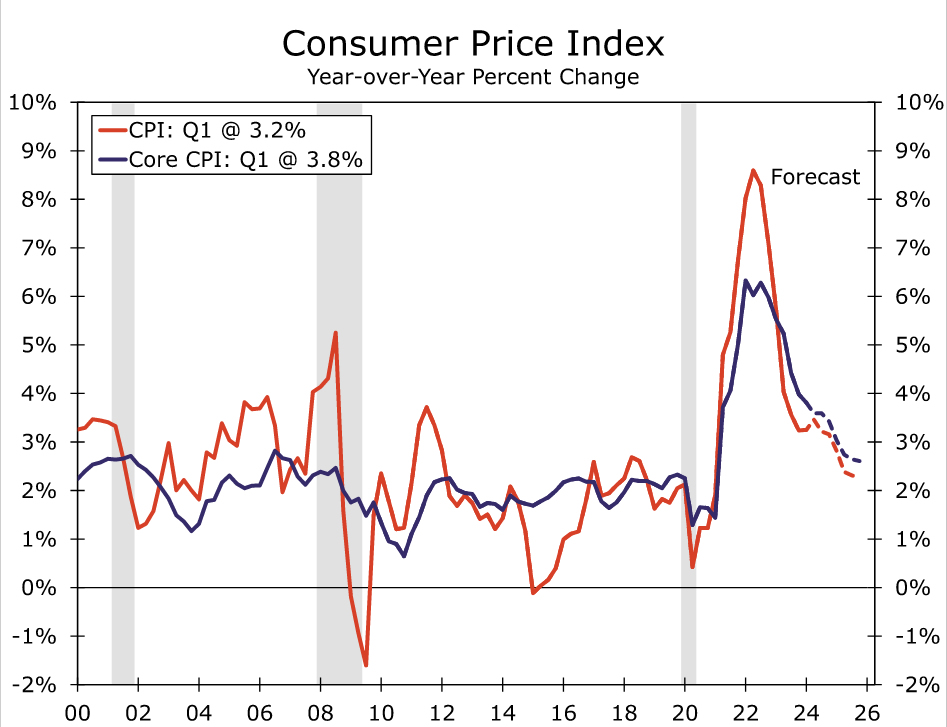
- Inflation gained significant momentum in 2021 and has remained persistent since, though the drivers have shifted. Gummed up supply chains and limited labor availability in 2020 helped push selling prices higher in 2021 and 2022. By our framework, the CPI broke into “severe” territory in Q4-2022 after spending six straight quarters more than three deviations above 2.0% on an annual basis. In 2023, supply chain and labor dynamics improved, but strong consumer demand continued to pressure prices higher.
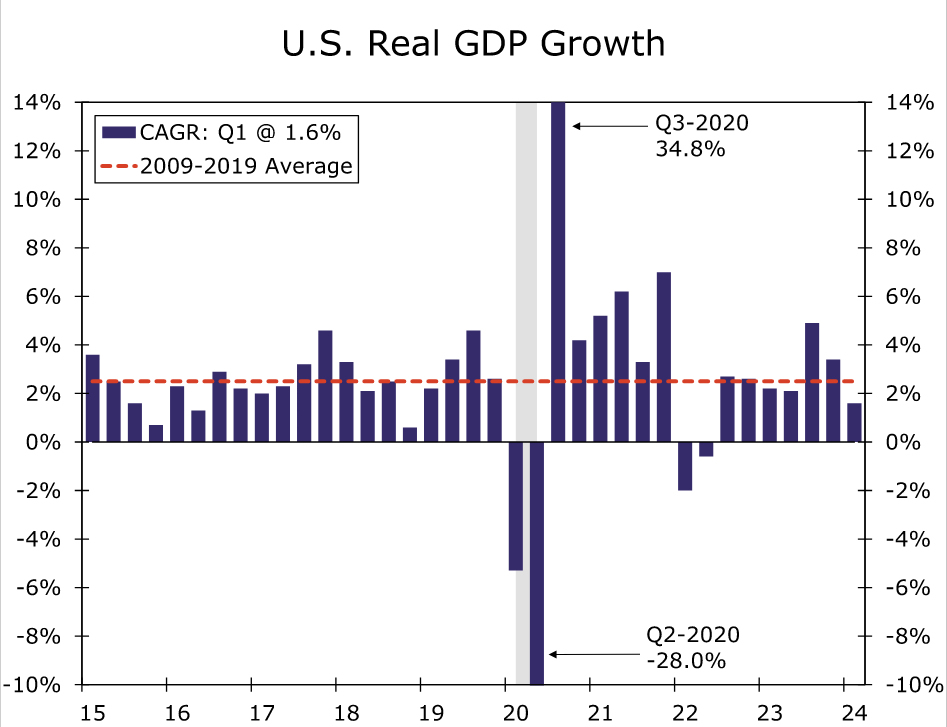
- Economic output has been mostly strong, and ample fiscal stimulus has supported household liquidity and consumption in the face of elevated price growth. That said, real GDP growth slowed below its prior cycle’s average in the first half of 2023 and in Q1-2024, pointing to a moderation in growth and a gradual loosening in demand.
- Though the Federal Open Market Committee has hiked the target range of the federal funds rate by 525 bps in just under two years, output growth remains respectable and inflation remains sticky. Fiscal support has ramped up over the past few years, further boosting aggregate growth, and the federal debt has increased to levels not seen since WWII.
- We suspect government purchases will moderate in coming quarters, which will dampen its contribution to real GDP growth. Though the unemployment rate is at a decades’ low today, we expect the labor market to gradually loosen as restrictive monetary policy continues to filter through. Less marked job growth will weigh on real disposable income, further dampening real GDP growth and inflation by pressuring consumer spending.
- Should our forecast come to fruition, our framework says the current bout of stagflation will end in the fourth quarter of this year. What was once a severe episode of stagflation in 2022 has downgraded to a mild case in the opening innings of 2024, but the path of inflation remains uncertain. We suspect the risk of stagflation remains elevated in coming years, especially if the labor market does not loosen as presently anticipated.
The Good, Bad and the Ugly
In the first installment of this series, we presented a simple framework to characterize stagflation using real GDP growth and CPI inflation. Using the framework, we identified 13 episodes of stagflation in the United States since 1950, with six of those episodes occurring in the 1970s. We then briefly summarized historical instances of stagflation in the second installment and left the latest episode to this final report.
Back in 2021, inflation gathered significant momentum. CPI inflation averaged 6.7% year-over-year in Q4-2021, up from an average of just 1.9% year-over-year in Q1-2021. Despite the moonshot in prices, real GDP growth remained well above its prior cycle’s average throughout the year amid surging labor demand and falling unemployment. Yet when the calendar turned to 2022, real GDP growth downshifted to -2.0% in Q1 and -0.6% in Q2. At the same time, CPI inflation continued to tear higher, averaging 8.0% and 8.6% in Q1 and Q2, respectively, on a year-ago basis.
As discussed in the first report of this series, our framework deems inflation as “severe” when the year-over-year percent change in the CPI comes in more than three standard deviations above 2.0%—the Federal Reserve’s inflation target—for at least six consecutive quarters. We use the standard deviation of CPI inflation in the prior business cycle as the benchmark; the CPI averaged 1.7% on a year-over-year basis with a standard deviation of 0.98 percentage points over the 2009-2019 economic expansion. By these measures, the CPI broke into “severe” territory in Q4-2022 after spending six straight quarters more than three standard deviations above 2.0% on an annual basis.
The drivers of inflation have shifted as the aftershocks from the pandemic have unwound. Immediately following the early lockdown days in 2020, businesses faced skyrocketing material and labor costs amid gummed up supply chains and limited labor availability. These cost dynamics helped push selling prices higher over the course of 2021 and into 2022. In 2023, strong consumer demand continued to pressure prices higher even as supply chain and labor dynamics improved, thereby shifting inflation toward the demand-pull variety.
While inflation has been persistent, economic output has been mostly strong. Real GDP expanded 5.8% in 2021, 1.9% in 2022 and 2.5% in 2023. Ample fiscal stimulus, in the form of relief checks and tax credits, has supported household liquidity and consumption in the face of elevated price growth. Despite the momentum in consumption, the framework designates this period as stagflation due to the two consecutive quarters of negative real GDP growth in the first half of 2022. We readily acknowledge that the drivers of real GDP’s contraction in those quarters were primarily net exports and inventories, which suggests underlying demand remained intact. That said, real GDP growth slowed below its prior cycle’s average of 2.5% in the first half of 2023 and in Q1-2024 (Figure 1). The moderation in growth, albeit teetering, points to a gradual loosening in demand.
A moderation in demand would come as welcome news to the Federal Reserve, if it helps to quell inflation. The Federal Open Market Committee has responded to the recent inflation bout by hiking the target range of the federal funds rate 525 bps in just under two years to 5.25-5.50% at present. The real fed funds rate (i.e., the upper bound target less CPI inflation) has been above 1% the past four quarters, suggesting that monetary policy settings are restrictive.
Yet the economy has seemingly defied the weight of higher interest rates, as output growth remains respectable and inflation remains sticky. Beyond stimulus checks to households, fiscal support in the form of federal aid to state and local governments, infrastructure funding and spending on other policy initiatives, such as veterans support and national defense, have ramped up over the past few years.1 These policies have boosted the federal government’s output and contribution to real GDP growth in recent quarters, which has helped to prop up aggregate demand. While supportive of economic growth, the federal debt has increased to levels not seen since the Second World War when measured as a share of GDP.
Stimulative fiscal policy typically puts upward pressure on inflation, although the degree to which inflation becomes entrenched depends on the labor market’s slack. Back in the late 1960s, President Johnson’s Great Society programs and other spending initiatives led to a ballooning federal deficit. At the same time, the unemployment rate was hovering below 4%, implying the labor market was near maximum employment. The mixture of ample fiscal support and a tight labor market meant that the economy did not have much capacity to keep wage pressures in check. Consequently, the CPI ramped up from 1968 and into 1970. The pressure on prices led to profit margin squeeze; the unemployment rate turned higher in 1970 and led the economy into a moderate recession.
Today, the unemployment rate is near a decades’ low, labor cost growth is solid and the fiscal deficit is swelling. Long-run fiscal challenges are likely to remain amid a rapidly aging population and elevated debt service costs. We suspect government purchases to moderate in the coming quarters, which will dampen its contribution to real GDP growth. As outlined in our latest monthly U.S. Economic Outlook, we expect the labor market to gradually loosen as restrictive monetary policy continues to filter through; we look for the FOMC to begin cutting its target range in September, which will keep policy tight in the coming months. Less marked job growth will weigh on real disposable income growth, which would pressure consumer spending. The ebbing in demand is poised to lead real GDP growth below the prior cycle’s trend and help inflation continue to ease (Figure 2).
Should our forecast come to fruition, our framework says the current bout of stagflation will end in the fourth quarter of this year. CPI inflation is no longer in “severe” territory, but it remains more than one standard deviation above 2% on an annual basis and real GDP growth has slipped below its previous cycle’s average. Thus, what was once a severe episode of stagflation back in 2022 has downgraded to a mild case in the opening innings of 2024. That said, the path of inflation is increasingly uncertain given heightened geopolitical risks across the globe, which have the potential to send oil prices higher and hamper supply chains anew.
Furthermore, the severity at the beginning of this stagflation episode has not been matched since the 1970s, when years of restrictive monetary policy were necessary to stamp out the “Great Inflation.” Structural inflation pressures today, such as the tight labor supply amid an aging demographic and deglobalization amid geopolitical tensions, point to a higher neutral rate of interest. Many analysts expect the FOMC to start cutting by the end of this year, but the stickiness in inflation has continually delayed the start date of easing and led to an upward drift in the median projection for the long-run federal funds rate. Unless the economy has meaningfully edged up its potential capacity, we suspect the risk of stagflation remains elevated in the coming years, especially if the labor market does not loosen as presently anticipated.2
Endnotes
1 – For more detail, see our colleagues special report, The Fiscal Tailwinds Are Still Blowing, from December 2023.
2 – This series is based on a 2024 American Economic Association Annual Meeting paper by Azhar Iqbal and Nicole Cervi titled “Characterizing Stagflation into Mild, Moderate and Severe Episodes: A New Approach”. Please contact the authors if interested in the full paper.


