
The EUR/USD is at an interesting and critical bounce or break spot. A bearish breakout could see the downtrend continue whereas a bullish break could indicate an expanded wave 4.
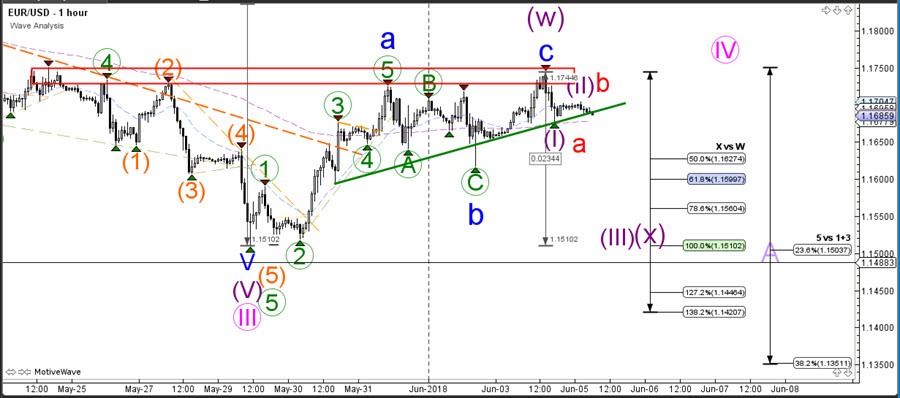
The EUR/USD seems to be in a wave 4 (pink) corrective pattern. Price has stopped at the 23.6% Fibonacci retracement level which is quite a shallow Fib level and the EUR/USD could move up to test a higher Fib such as the 38.2% Fib.
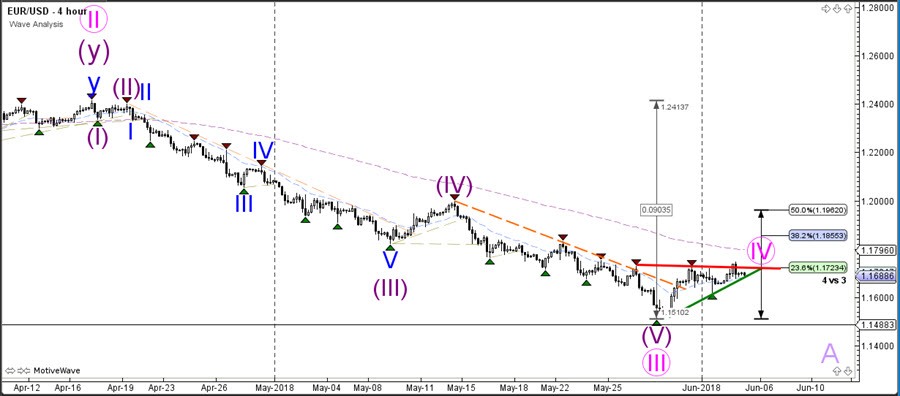
The EUR/USD is challenging the support zone at around 1.1675. A bearish break could indicate a bearish 5 wave pattern or a larger WXY (purple) correction within wave 4. An ABC pattern would probably make a bullish bounce around 1.16 whereas a bearish impulse would show more bearish momentum. A break above the 1.1750 resistance zone however could expand the bullish correction and price could move up towards the 38.2% Fib on the 4 hour chart.


