
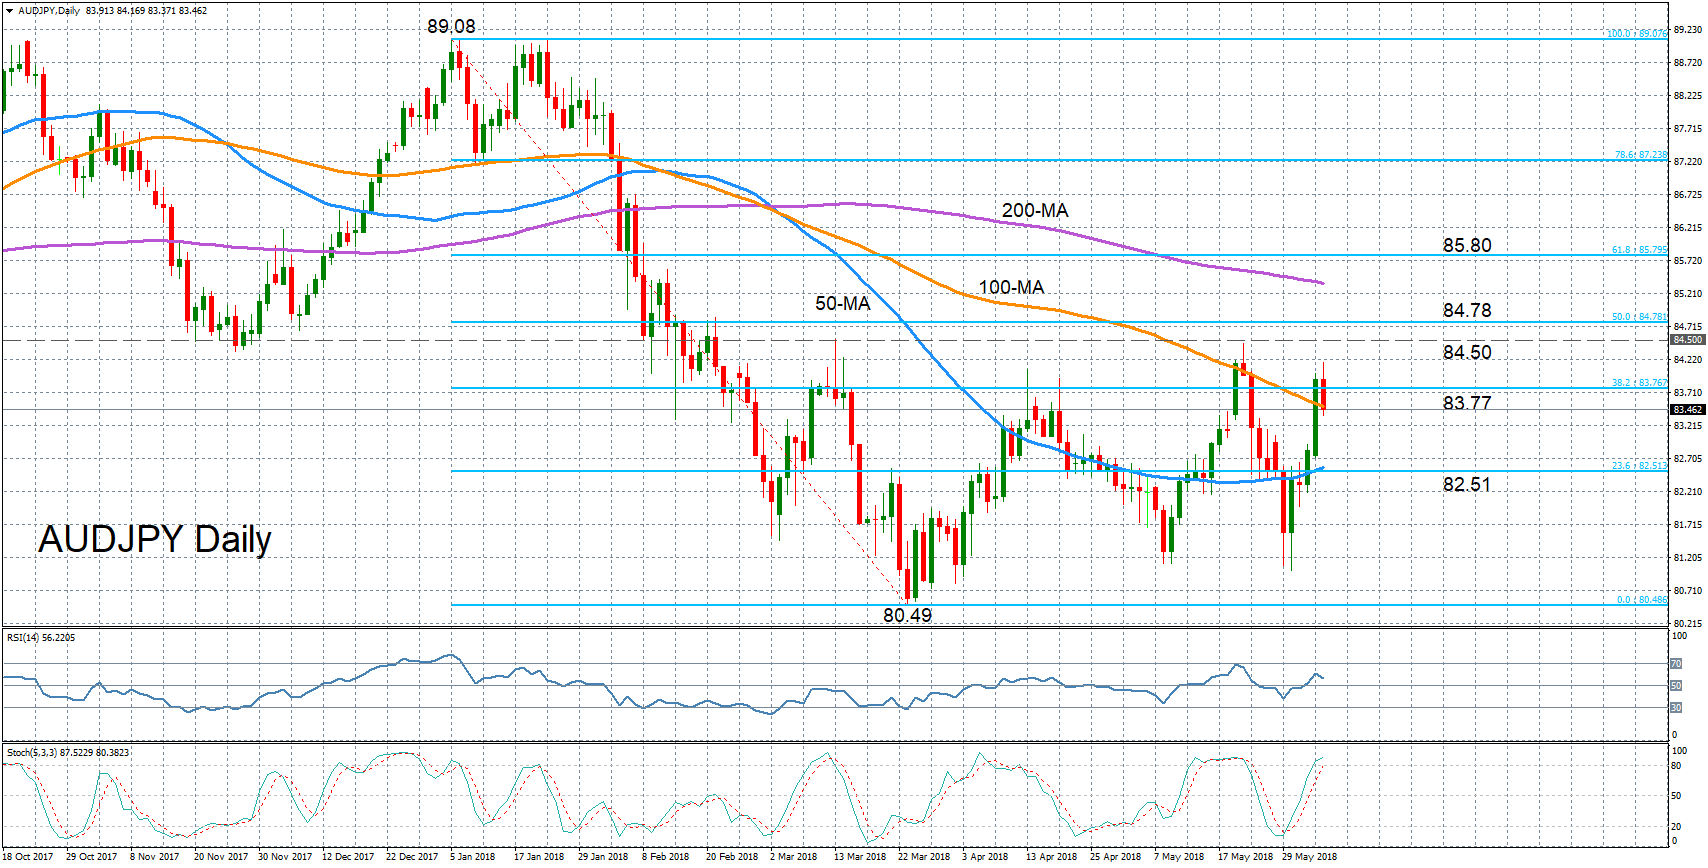
AUDJPY hit a two-week peak of 84.17 earlier today before pulling lower. Today’s high marked a sharp reversal from the two-month low of 81.01 touched on May 30.
The near-term bias remains bullish but momentum indicators suggest the rebound may be running out of steam. The RSI is pointing downwards, though it remains in positive territory, while the %K line of the stochastic oscillator is flatter after moving into overbought levels and could be heading for a bearish crossover with the %D line.
Immediate support is being provided by the 100-day moving average around 83.50. If the price fails to hold above this support and closes the session below it, the focus would shift back to the downside. Deeper losses would bring the 50-day moving average within range, which is overlapping with the 23.6% Fibonacci retracement level of the downleg from 89.08 to 80.49. A breach of this level, around 82.50, would see the short-term bias turn negative. Further down, March’s 16-month low of 80.49 should be watched. If broken, it would signal a return to a bearish outlook in the medium term, which had reverted to neutral following the sideways trading since March.
Alternatively, if the positive momentum strengthens and the pair heads higher again, immediate resistance would come from the 38.2% Fibonacci level at 83.77. A successful climb above this level would likely see the March and May tops near 84.50 once again acting as resistance. Above this barrier, the 50% Fibonacci at 84.78 is a key level that needs to be beaten to achieve a more sustainable uptrend.


