
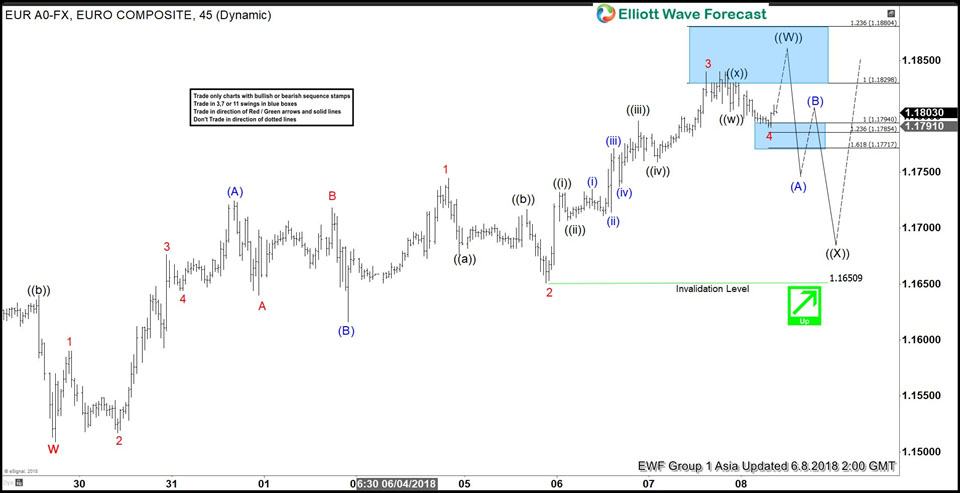
EURUSD short-term Elliott wave view suggests that the decline to 1.1509 on 5/29/2018 low ended Cycle degree wave “w”. Above from there, the bounce is taking place as Elliott wave zigzag structureto end the Primary degree wave ((W)) cycle. Afterwards, the pair is expected to do a pullback in Primary degree wave ((X)) in 3, 7 or 11 swings before further upside is seen.
The Zigzag structure is the most common 3 waves corrective pattern, which is labeled as A, B, C. The internal oscillation of swings consists of a 5-3-5 structure where wave A & C unfold in 5 waves, while wave B can any 3 waves corrective pattern. In EURUSD case, the Intermediate wave (A) of ((W)) unfolded in 5 waves structure where Minor wave 1 ended 1.159 high, Minor wave 2 ended at 1.1517, Minor wave 3 ended at 1.1676, Minor wave 4 ended at 1.1644 and bounce to 1.1724 ended Minor wave 5 of (A).
Down from there, the pullback to 1.1616 low ended Intermediate wave (B) as Zigzag structure where Minor wave A ended at 1.1640, Minor wave B ended at 1.1718 and Minor wave C of (B) completed at 1.1616. Up from there, Intermediate wave (C) of ((W)) remains in progress as another 5 waves structure which has already reached the 100%-123.6% Fibonacci extension area of Intermediate wave (A)-(B) at 1.1830-1.1880. Therefore, the pair has reached the minimum extension area already. However, while it stays above 1.1650 low, the pair has scope to see 1 more marginal push higher within blue box area to complete Primary wave ((W)) higher. Then it should do a pullback in primary wave ((X)) in 3, 7 or 11 swings before further upside is seen. We don’t like selling the pair in the proposed pullback.
EURUSD 1 Hour Elliott Wave Chart


