
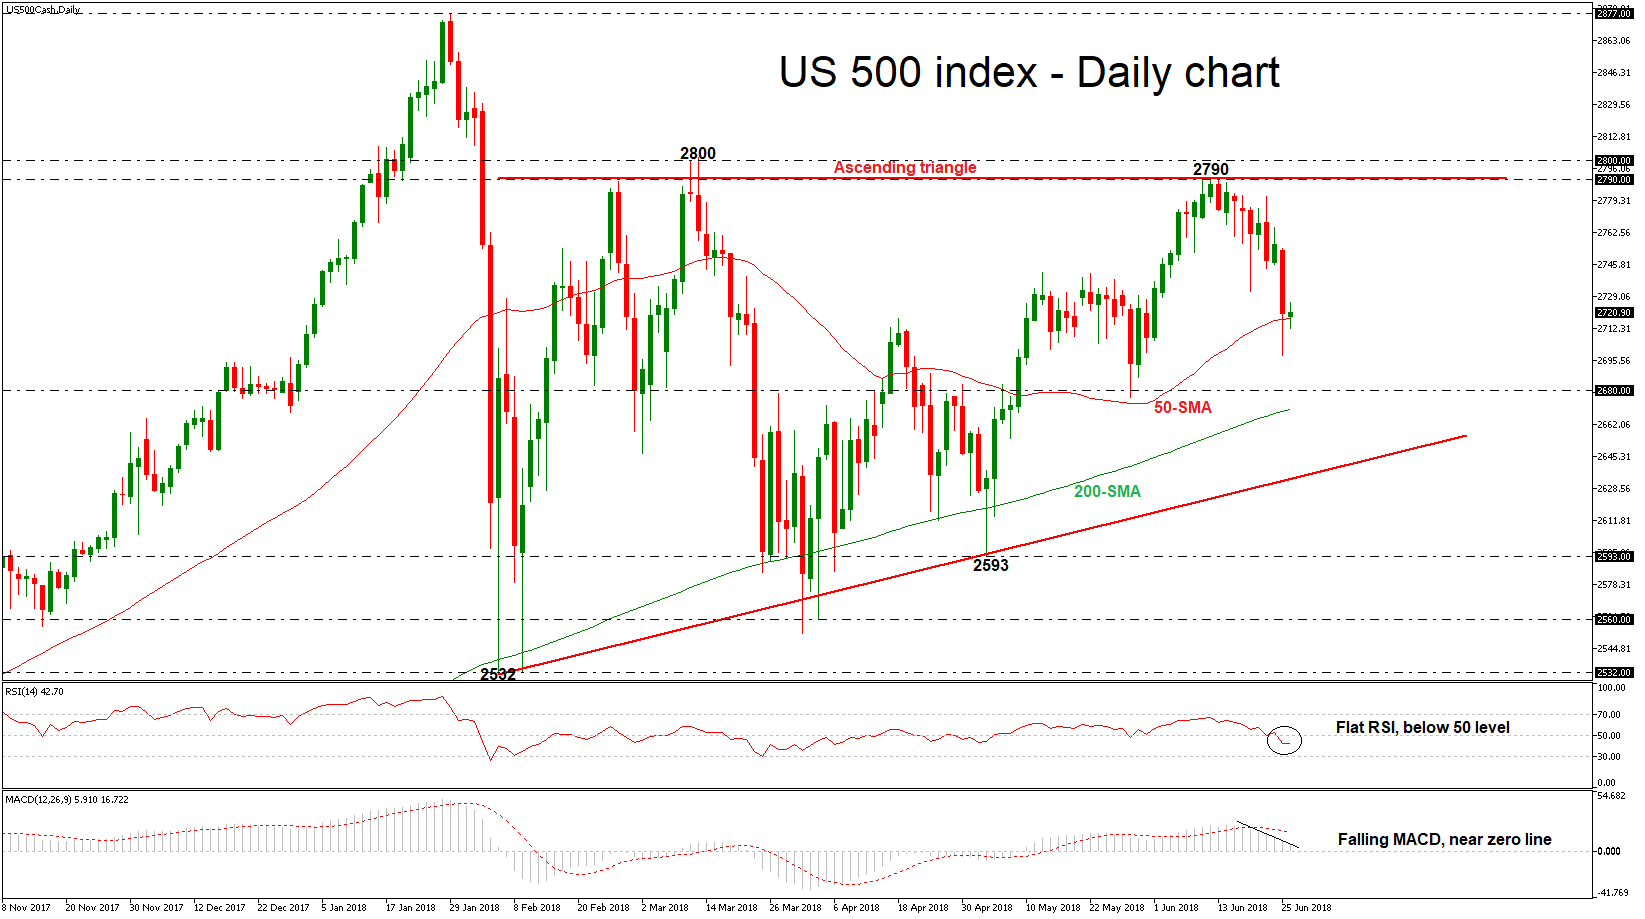
The US 500 index recorded a strong bearish day on Monday, losing more than 1% from its performance but remained above the 50-day simple moving average (SMA). However, the index is trading within an ascending triangle started on February 6, but there is no change in the longer timeframe from the latest movement.
Momentum indicators in the daily chart though are currently supporting that the negative momentum is likely to strengthen in the short-term. Specifically, the RSI is flattening below 50 and the MACD continues the falling momentum below its red trigger line.
Should the price decisively close below the 50-SMA, bears could extend the downward movement towards the 2680 region, which has been a major support in the past. Further decreases below this level, could then target the area around the 200-SMA, near 2669.8 at the time of writing. In case of a slip below this line, the next barrier to watch is the uptrend line, currently near 2650.
On the flip side, an advance could meet the 2790 resistance level, taken from the peak on June 12. Slightly above this zone, the price could retest the March 13 high of 2800.
Overall, in the bigger picture, the index remains below the key level of 2790, which is acting as the upper boundary of the ascending triangle, indicating that the price needs stronger momentum for continuing the upward rally.


