
EUR/USD
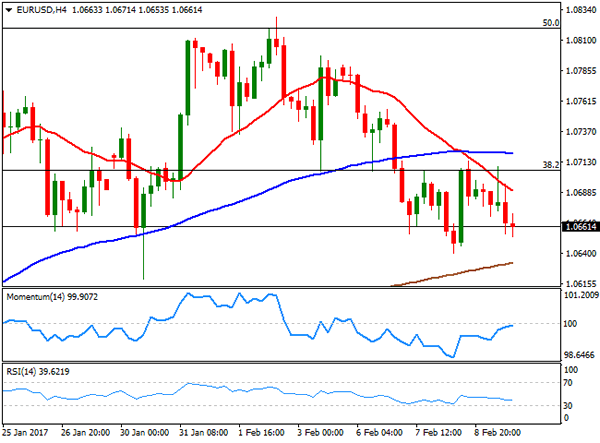
For a change, the American dollar advanced in the US afternoon, tracking a rally in US stocks after US President Trump said that his administration will be announcing "something phenomenal in terms of taxes" during the upcoming weeks. Dollar gains are tepid to say the least, and the currency is mixed across the board, with the EUR and the JPY underperforming, but commodity-related currencies holding on to gains. The EUR/USD pair gave back its Wednesday’s gains, but held above the weekly low of 1.0640, settling some 20 pips above this last by the end of the US session. Seems stocks traders are believing Mr. president’s words, but across the FX market, traders are not convinced, particularly after FED’s Bullard said that rates can remain low all through 2017.
There was little in the fundamental news that could affect the pair this Thursday, with minor releases both shores of the Atlantic. Germany released its December trade balance data, showing a lower-than-expected surplus of €18.4B from a previously revised €21.8B. Imports in the month were unchanged, but exports plunged by 3.3%. For the whole 2016, exports increased by 1.2%, while imports by 0.6%, exceeding 2015 figures. In the US, weekly unemployment claims beat expectations, falling to a three-month low of 234K against the 250K expected, while wholesale inventories remained unchanged at 1%.
Technically, the pair is at risk of falling further, as in the 4 hours chart, the price was contained by a bearish 20 SMA that extended its slide below the 100 SMA, while technical indicators have been unable to recover into positive territory, and particularly the RSI, has resumed its decline within negative territory, now heading south around 38. Adding to the bearish case is the fact that the pair was unable to regain the 1.0700 threshold, discouraging bulls. Below 1.0640, the pair has scope to extend its decline down to the 1.0580/90 this Friday.
Support levels: 1.0640 1.0610 1.0585
Resistance levels: 1.0710 1.0750 1.0800

USD/JPY
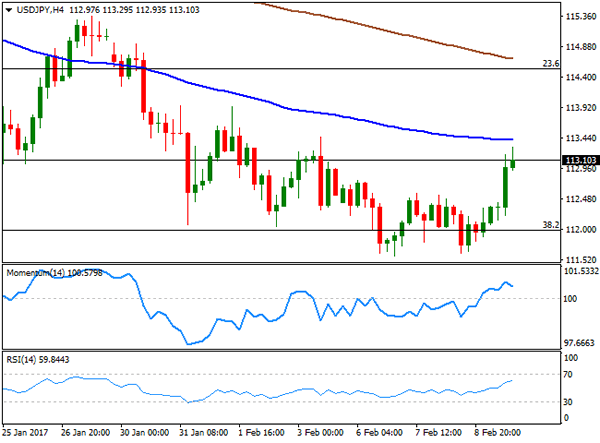
The USD/JPY pair added roughly 100 pips in the US afternoon, following comments from US President Donald Trump, vowing to make a shocking announcement on tax’s reform during the upcoming weeks, in a meeting with airline industry leaders. The headlines wake-up risk appetite, reviving the Trump-trade and sending US equities to all-time highs, weighing on the safe-haven yen. During the upcoming Asian session, Japan will release its Domestic Corporate Goods Price Index figures for January, which will hardly affect the yen. News coming from the US, despite minor, were also encouraging, with weekly unemployment claims down to 234K for the week ending February 4th, against previous 246K. The pair stands at fresh weekly highs, and the bearish potential has eased, but not yet reverted. In the 4 hours chart, the pair pared gains a few pips below a bearish 20 SMA, whilst technical indicators are turning modestly lower within positive territory, indicating that the upward potential is limited. The pair bounced for fourth consecutive day from its 100 DMA, now around 111.80, and held above the 38.2% retracement of November/December around 112.00, the support area that the pair needs to break to resume its bearish trend. On the other hand, it will take an extension beyond the daily high of 113.29 to see the pair extending its advance towards the 114.00/50 price zone.
Support levels: 111.60 111.25 110.80
Resistance levels: 112.10 112.60 113.00
GBP/USD
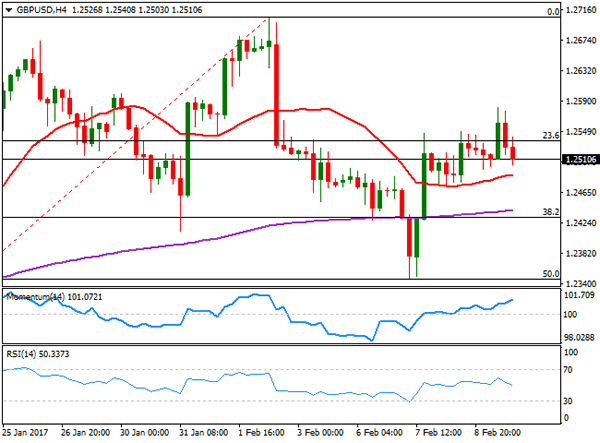
The GBP/USD pair retreated from a fresh weekly high of 1.2581 in the US afternoon, ending the day marginally lower around the 1.2500 figure. There were no big news coming from the US this Thursday, but news late Wednesday indicating that the Brexit bill passed through the House of Commons without amendments, incremented the positive sentiment towards the British Pound. This Friday, the UK will release its manufacturing and industrial production figures for December, expected to have risen at a slower pace than in the previous month. Despite the negative close, the technical picture is far from suggesting upcoming Pound weakness, as the GBP/USD pair ended the day above its 20 SMA, now around 1.2480, whilst the Momentum indicator maintains its bullish slope within positive territory, although the RSI indicator has turned south and currently pressures the 50 level, suggesting the pair may extend its decline at least to 1.2470, Thursday’s low. Also, favoring a downward move is the fact that the pair was unable to settle above 23.6% retracement of its January/February rally at 1.2535, although renewed buying interest above it can see the pair regaining the 1.2600 level before the week is over.
Support levels: 1.2470 1.2425 1.2390
Resistance levels: 1.2535 1.2585 1.2620
GOLD
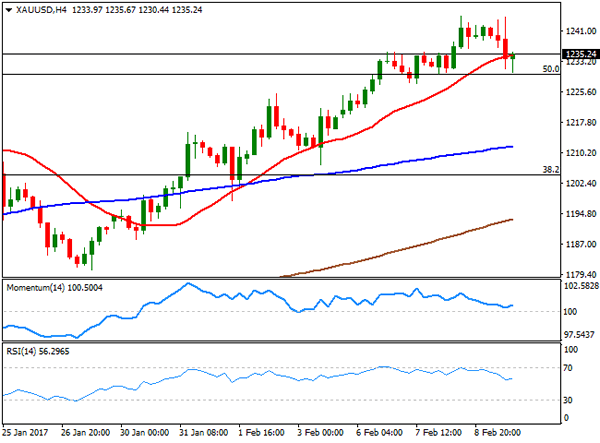
Gold closed the day with losses after spending the day near the three-month high posed on Wednesday, weighed by renewed dollar’s demand in the US afternoon. Spot closed the day around $1,235.10 a troy ounce, as market’s sentiment improved, with investors rushing into high-yielding assets in detriment of the safe-haven metal. The daily chart for the commodity shows that it held above a key support, the 50% retracement of the November/December slide around 1,230.00, while the 20 DMA is advancing above the 100 DMA, both far below the current level and limiting chances of a steeper decline. Technical indicators in the mentioned chart remain within positive territory, with the Momentum flat and the RSI hovering around 67. In the shorter term, and according to the 4 hours chart, the price is currently struggling around a bullish 20 SMA, whilst technical indicators are modestly bouncing from their mid-lines after correcting extreme overbought readings.
Support levels: 1,230.00 1,219.40 1,210.10
Resistance levels: 1,244.70 1,255.15 1,263.90
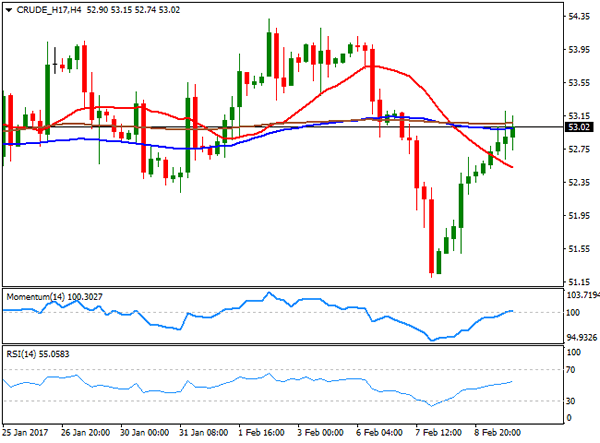
WTI CRUDE
West Texas Intermediate crude oil futures advanced for a second consecutive day, with the commodity setting a couple of cents above 53.00. WTI set a daily high of $53.20 a barrel, still underpinned by Wednesday’s news, showing an unexpected draw in US gasoline stockpiles that suggest rising demand for the commodity. Despite a large build in crude inventories, the commodity advanced for a second consecutive day, although the price continues developing within the range set mid December. Technically, the daily chart shows that the price is now around a flat 20 SMA, whilst technical indicators have turned flat around their mid-lines, indicating a limited upward scope. In the 4 hours chart, the price advanced beyond a still bearish 20 SMA, but is currently struggling with the 100 and 200 SMAs, both flat, whilst the Momentum indicator heads higher above its 100 level and the RSI remains flat around 54, in line with the longer term view.
Support levels: 52.50 51.80 51.10
Resistance levels: 53.20 53.65 54.20
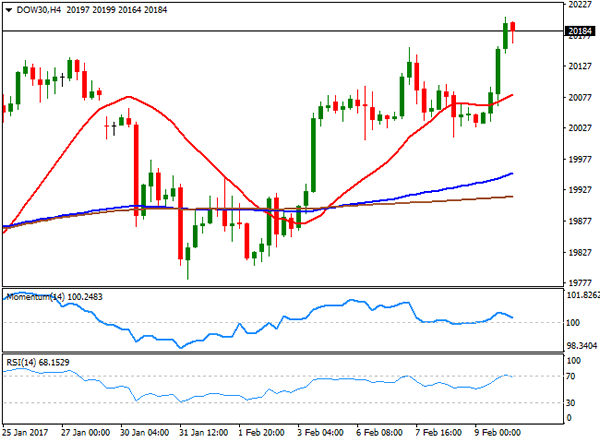
DJIA
Wall Street’s three main indices all closed at record highs as financials rallied, with the Dow Jones Industrial Average settling at 20172.40, up 0.59% or 118 points. The Nasdaq Composite added 32 points, to 5,715.18 while the S&P closed at 2,307.87, 0.58% higher. Further supporting US equities were higher oil prices and US President Trump comments about an upcoming "phenomenal" tax plan. The Dow traded as high as 20,206 and the daily chart shows that it extended further above a modestly bullish 20 DMA, while the RSI indicator turned sharply higher, now around 67, as the Momentum keeps consolidating within positive territory. Shorter term, and according to the 4 hours chart, the index is the index is biased higher, as the 20 SMA has accelerated its advance beyond the 100 and 200 SMAs, with the shortest maintaining a strong upward slope some 100 points below the current level, whilst the RSI indicator consolidates around 67. In this last time frame, the Momentum indicator eased within positive territory, rather reflecting low volumes after the close and the retracement from the mentioned record high.
Support levels: 20,157 20,090 20,013
Resistance levels: 20,210 20,270 20,340
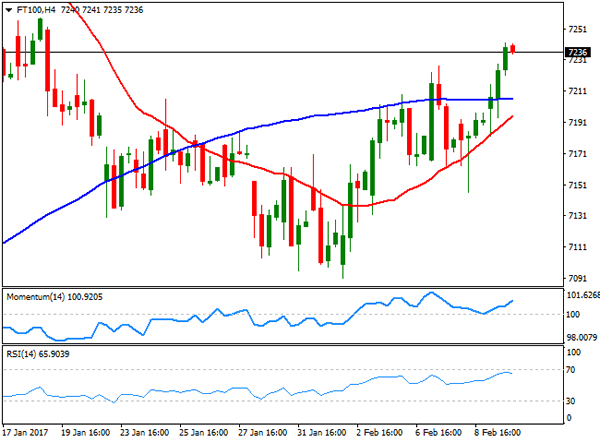
FTSE 100
The FTSE 100 closed at 7,229.50, up 0.57% or 40 points, its highest settlement in three-weeks, backed by higher oil prices that boosted energy-related companies. International Consolidated Airlines Group topped winners list, up 3.51%, followed by Royal Bank of Scotland that added 2.51%, as strong earnings from French Société Générale that beat forecasts. Mining-related equities were among the worst performers, with Anglo American down 2.67% and Fresnillo ending the day 2.55% lower. The daily chart shows that the Footsie settled above a still flat 20 DMA, whilst technical indicators entered positive territory, maintaining bullish slopes and favoring additional gains, particularly after the Pound eased late Thursday. In the 4 hours chart the index has settled above its 20 and 100 SMAs that anyway lack directional strength, whilst the Momentum indicator heads north well above its 100 level and the RSI indicator consolidates around 65, in line with the shorter term perspective.
Support levels: 7,205 7,163 7,128
Resistance levels: 7,258 7,312 7,354
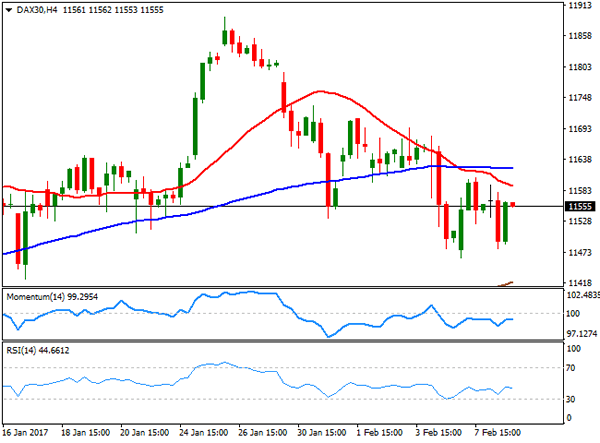
DAX
European equities closed higher, with the German DAX up 100 points to 11,642.86, helped by a recovery in oil prices and positive earnings reports. In Germany Commerzbank reported earnings above expectations, but closed the day down 1.96%, after the bank’s CFO said that expectations are that 2018 will bring a moderate negative capital impact. Still, most components closed in the green with Adidas topping gainers’ list, up by 2.81%, followed by RWE AG which added 2.42%. The benchmark holds around the mentioned close ahead of the Asian opening, maintaining a neutral stance in the daily chart, given that the index is currently around a horizontal 20 SMA, whilst the Momentum indicator continues lacking directional strength around its 100 level. The RSI indicator heads modestly higher around 54, limiting the downside, but not enough to confirm an upward move. In the 4 hours chart, the index is a few points above its 20 and 100 SMAs whilst technical indicators stand within positive territory, but with the RSI losing upward strength, also not enough to confirm a bullish extension ahead.
Support levels: 11,605 11,545 11,498
Resistance levels: 11,680 11,734 11,794


