
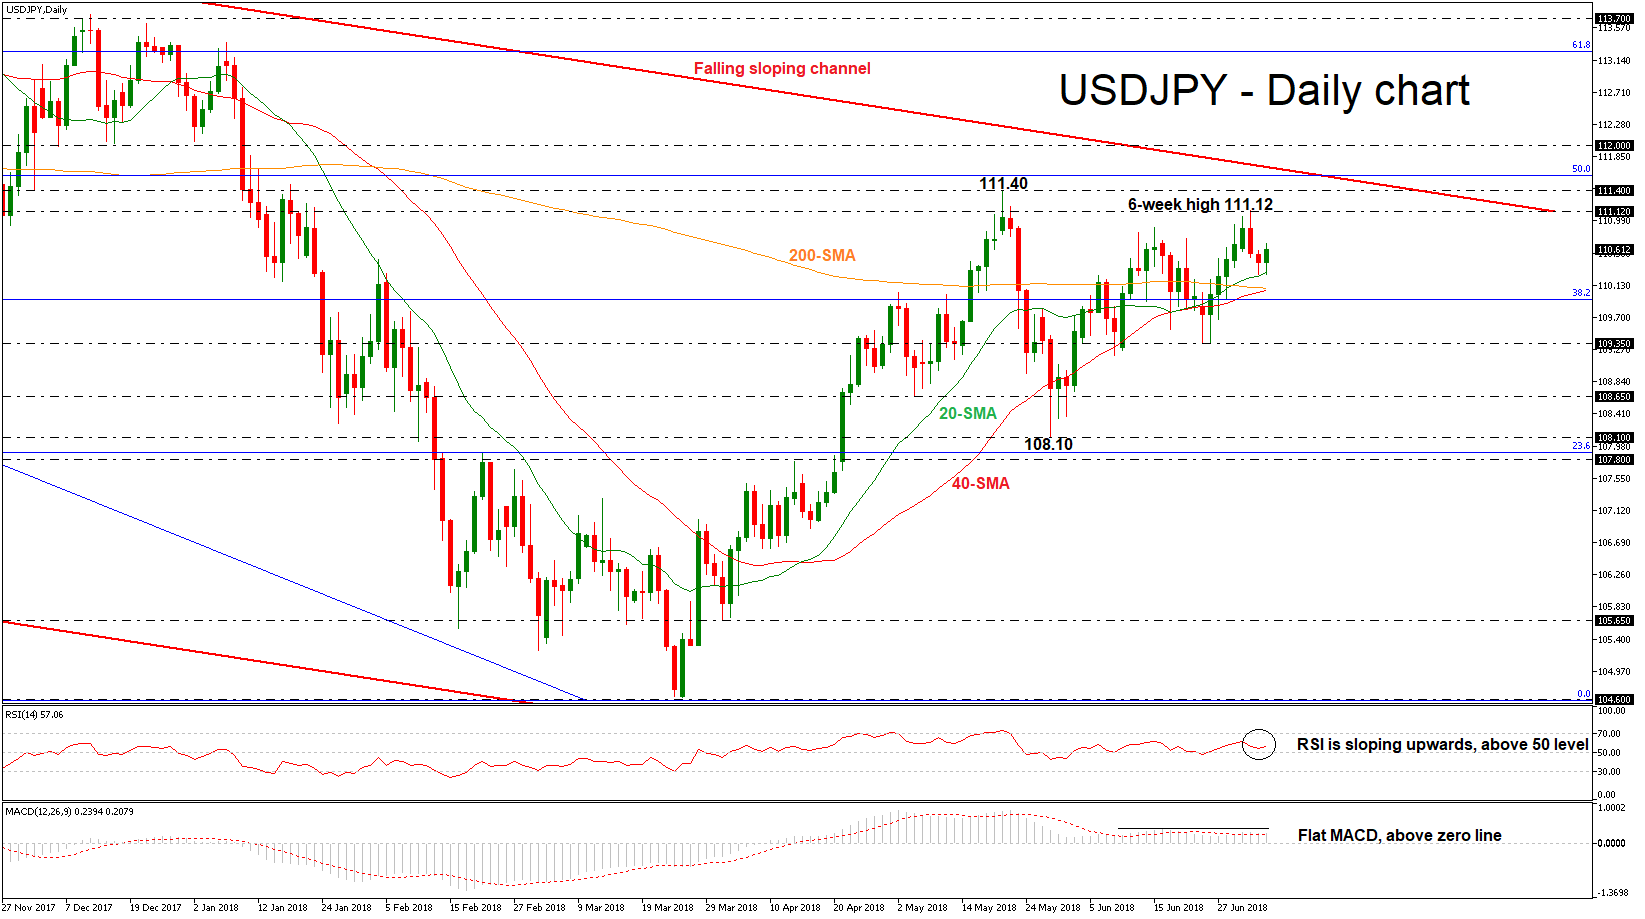
USDJPY is on course to set a bullish day after two straight negative sessions. The price surpassed the moving averages in the previous week and challenged a fresh six-week high of 111.12 before the slip to the 20-day simple moving average (SMA). The momentum indicators are supportive of the neutral to bullish picture in the near-term.
Technically, the RSI indicator is sloping slightly to the upside in the positive territory, while the MACD oscillator is flattening above the zero line and near its red-trigger line.
Should the market edge higher, resistance could be met between the 111.12 resistance level and the 111.40 barrier. Slightly higher the 50.0% Fibonacci mark near 111.60 could be in focus. A leg above this area could send prices towards the 112.00 psychological barrier, which currently is in the path of the descending trend line of the longer-term falling sloping channel. In case of an upside violation of this level, it could shift the bearish bias to bullish.
However, if the pair records some losses and closes below the 38.2% Fibonacci, support could be met at the 109.35 hurdle. A dive below this level could drive the pair until the 108.65 obstacle, taken from the low on May 4.
Having a look at the bigger picture, USDJPY has been trading within a descending sloping channel since December 2016, while in the medium-term the market holds in an ascending movement after the rebound on the 104.60 support.


