
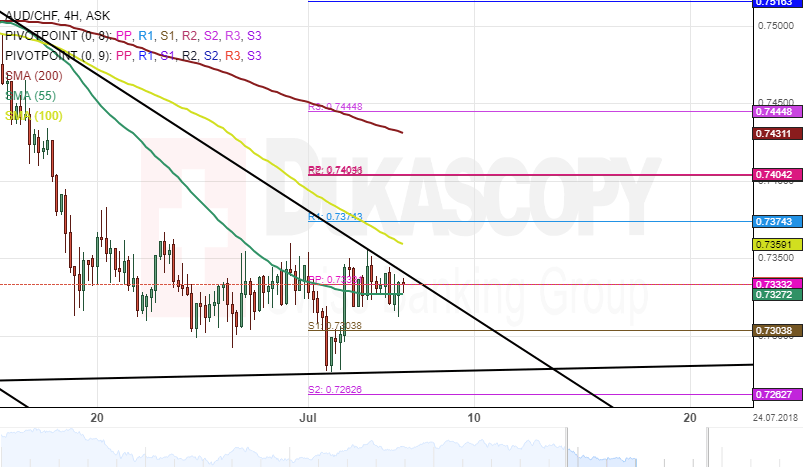
The Australian Dollar has been weakening against the Swiss Franc in a steep descending pattern. This movement has been bounded by a one month channel down.
The AUD/CHF currency pair has been moving sideways since June 19, bouncing between the 55-hour simple moving average to the south and the 100-hour SMA to the north.
Technical indicators flash strong buy signals on the four-hour time frame. Nevertheless, some downward potential is still apparent in the market during the following trading sessions.


