
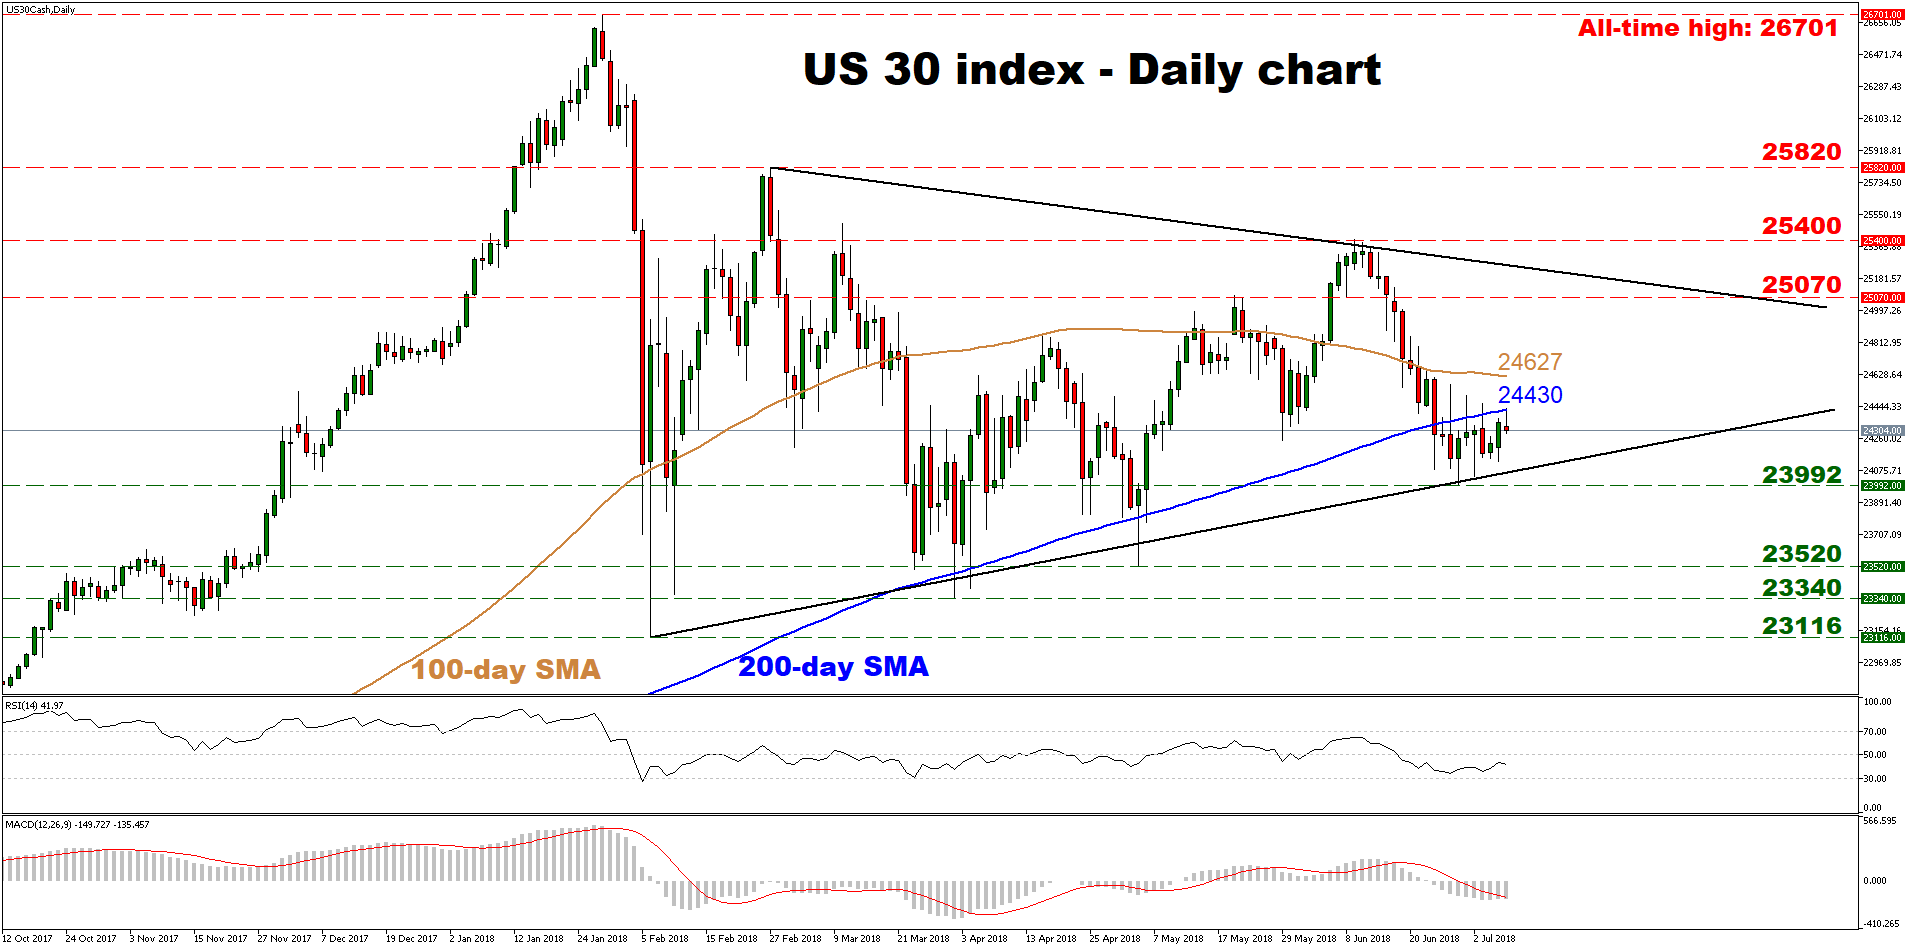
The US 30 index has been trading within a symmetric triangle formation since its plunge in early-February, posting higher lows but also lower highs on the daily chart. The outlook currently appears neutral, with a decisive break on either side of the aforementioned triangle needed to determine the medium-term bias.
Looking at short-term momentum oscillators, they suggest the next move may be to the downside. The RSI was recently rejected from near its neutral 50 level and has turned down again, while the MACD is also below its red trigger line.
Further declines could encounter immediate support near the crossroads of the lower bound of the triangle and the two-month low of 23,992. A clear break below that area would turn the bias to negative, and could set the stage for further declines, initially towards the May 3 low of 23,520. Even lower, support may be found around the April 2 trough of 23,340, before the attention shifts to the February 6 bottom of 23,116.
On the flipside, advances could stall initially near the 200- and 100-day moving averages, at 24,430 and 24,627 respectively. Even higher, the intersection of 25,070 and the upper bound of the aforementioned triangle may come into view, with a decisive upside break of that zone turning the outlook to positive and opening the way for the June 11 peaks of 25,400. After that, the February 27 high of 25,820 would be eyed, before the focus turns to the all-time high of 26,701.
Overall, the outlook currently appears neutral, with a significant break on either side of the triangle pattern likely to determine the broader directional wave.


