
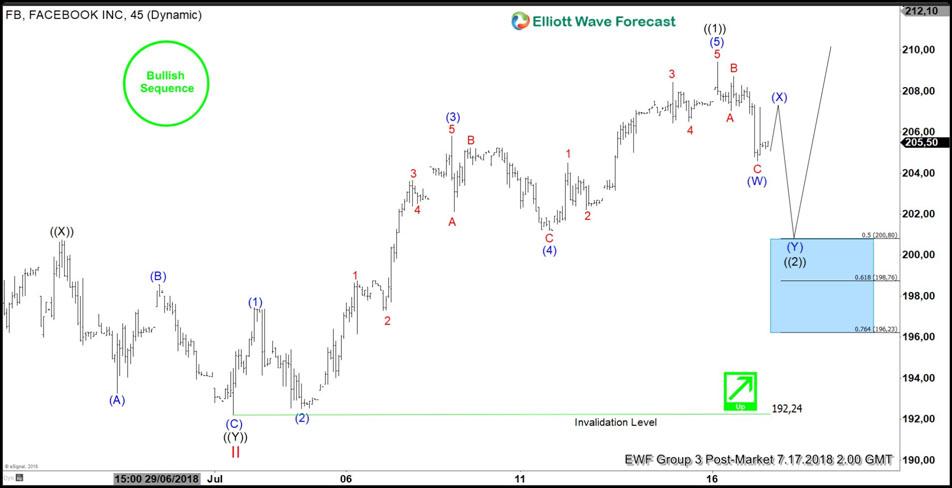
Facebook ticker symbol: $FB short-term Elliott Wave analysis suggests that the decline to $192.22 low ended cycle degree wave II as double three structure. Up from there, the stock is rallying higher and making new all-time highs within cycle degree wave III. Up from $192.22 low, the rally to $208.2 high ended primary wave ((1)). The internals of that rally took place in the form of an impulse structure with lesser degree cycles showing an internal subdivision of 5 waves in each leg higher.
Up from $192.22 low, the rally higher to $197.45 higher intermediate wave (1) of ((1)) in 5 waves structure. Down from there, the pullback to $192.52 low ended intermediate wave (2) of ((1)) in 3 swings. Up from there, the rally higher to $205.80 ended intermediate wave (3) of ((1)) in 5 waves structure. Down from there, the pullback to $201.20 low ended intermediate wave (4) of ((1)) in 3 swings as a Flat. Then the rally higher to $208.2 high ended intermediate wave (5) of ((1)) in another lesser degree 5 waves.
Below from there, the stock is correcting the cycle from 7/02/2018 low ($192.22) in primary wave ((2)) pullback. The pullback is expected to find buyers in 3, 7 or 11 swings at the extreme areas. Near-term focus remains towards $200.80-$198.76 50%-61.8% Fibonacci retracement area as target area for the pullback. Afterwards, the stock is expected to resume higher provided pivot at $192.22 low stays intact or it should react higher in 3 waves at least. We don’t like selling it.
Facebook 1 Hour Elliott Wave Chart


