
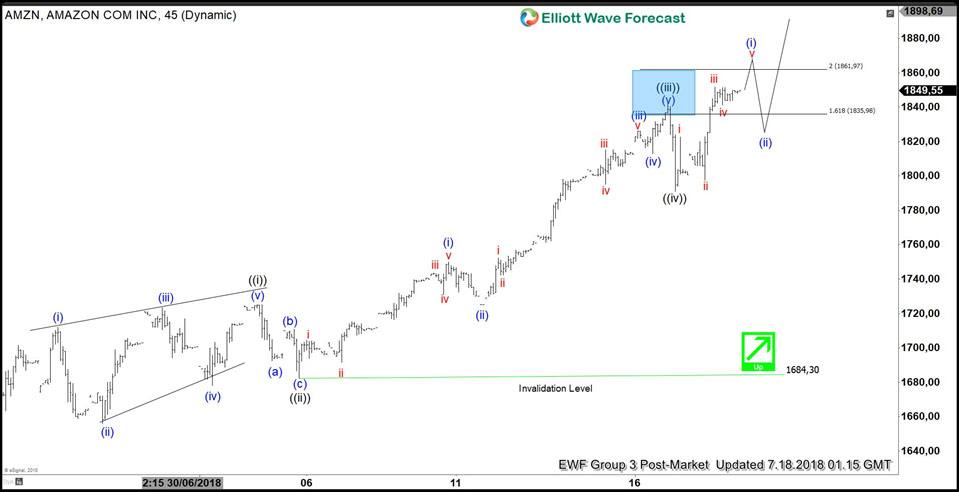
Amazon ticker symbol: $AMZN short-term Elliott wave analysis suggests that the cycle from 6/25/2018 low ($1646.31) is rallying higher in an impulse structure. This suggests that the internal sub-division of each leg higher is unfolding as 5 waves structure of lesser degree i.e Minute wave ((i)), ((iii)) & ((v)), whereas Minute wave ((ii)) & ((iv)) has subdivision of 3 corrective waves.
Up from $1646.31 low, a rally higher to $1725 high completed Minute wave ((i)) in 5 waves leading diagonal structure. Down from there, the 3 waves pullback to $1684.30 low ended Minute wave ((ii) as zigzag. Above from there the stock made another 5 waves advance which ended Minute wave ((iii)) at $1841.95 peak. Below from there, the pullback to $1791 low ended Minute wave ((iv)) in lesser degree 3 swings. Up from there Minute wave ((v)) remains in progress which is expected to unfold in another 5 waves structure.
The minimum extension area for Minute wave ((v)) i.e inverse 1.236-1.618% Fibonacci extension of Minute wave ((iv)) comes at $1853.82-$1873.35. In case of further extension, Minute wave ((v))=((i)) target area comes at $1868.58-$1887.15 area for the completion of cycle from 6/25/2018 low in Minor wave 1 or wave A. Afterwards, the stock is expected to do a pullback in Minor wave 2 or wave B in 3, 7 or 11 swings before further upside is seen provided the pivot from $1646.31 low stays intact. We don’t like selling it.
Amazon 1 Hour Elliott Wave Chart


