
Amazon ticker symbol: $AMZN short-term Elliott wave analysis suggests that pullback to $1646.48 low ended intermediate wave (2). Above from there, the stock is rallying higher in intermediate wave (3) higher. The internals of that extension higher is unfolding as Elliott wave impulse structure with sub-division of 5 waves structure in lesser degree Minor wave 1, 3 and 5.
Above from $1646.48 low, the rally to $1858.88 high ended Minor wave 1. The internals of that rally higher took place in another 5 waves impulse sequence in lesser degree cycles. The first leg of a rally to $1725 high ended Minute wave ((i)) as Leading diagonal structure. Then the pullback to $1682.15 low ended Minute wave ((ii)) pullback as a Zigzag correction. Up from there, the rally higher to $1841.95 ended Minute wave ((iii)) in 5 waves. Minute wave ((iv)) pullback ended at $1791 low, and Minute wave ((v)) of 1 ended at $1858.88 high.
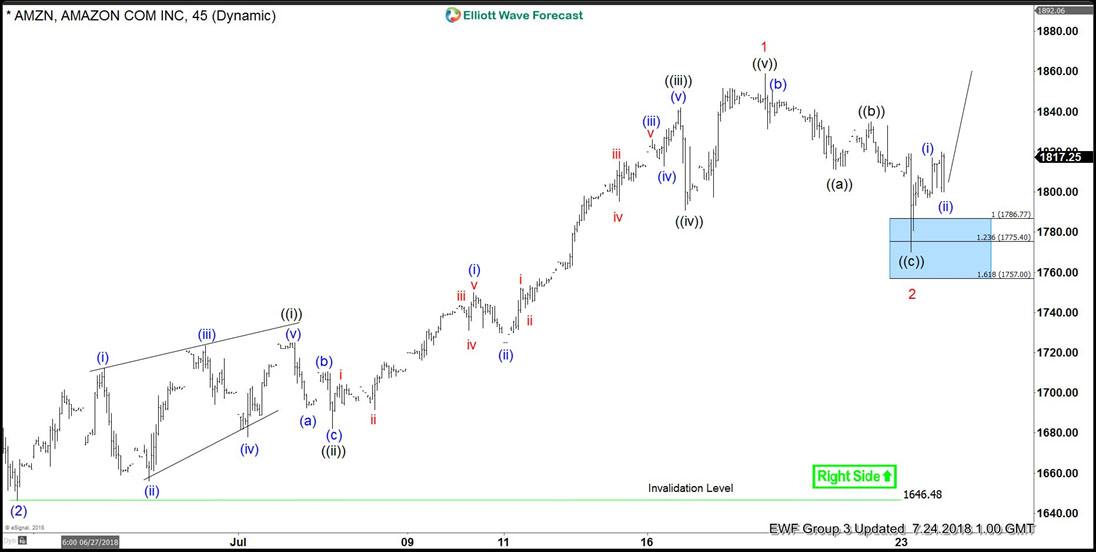
Below from there, the stock did a 3 wave pullback in Minor wave 2, which is proposed to have completed the correction against $1646.48 cycle low. After reaching the blue box 100%-123.6% Fibonacci extension area at $1786.77-$1775.40. However, a break above $1858.88 high remains to be seen to validate this view & until then, a double correction lower in Minor wave 2 can’t be completely ruled out. Near-term, while dips remain above $1769.99 low and more importantly above $1646.88 low the stock is expected to resume the upside. We don’t like selling it.
Amazon 1 Hour Elliott Wave Chart


