
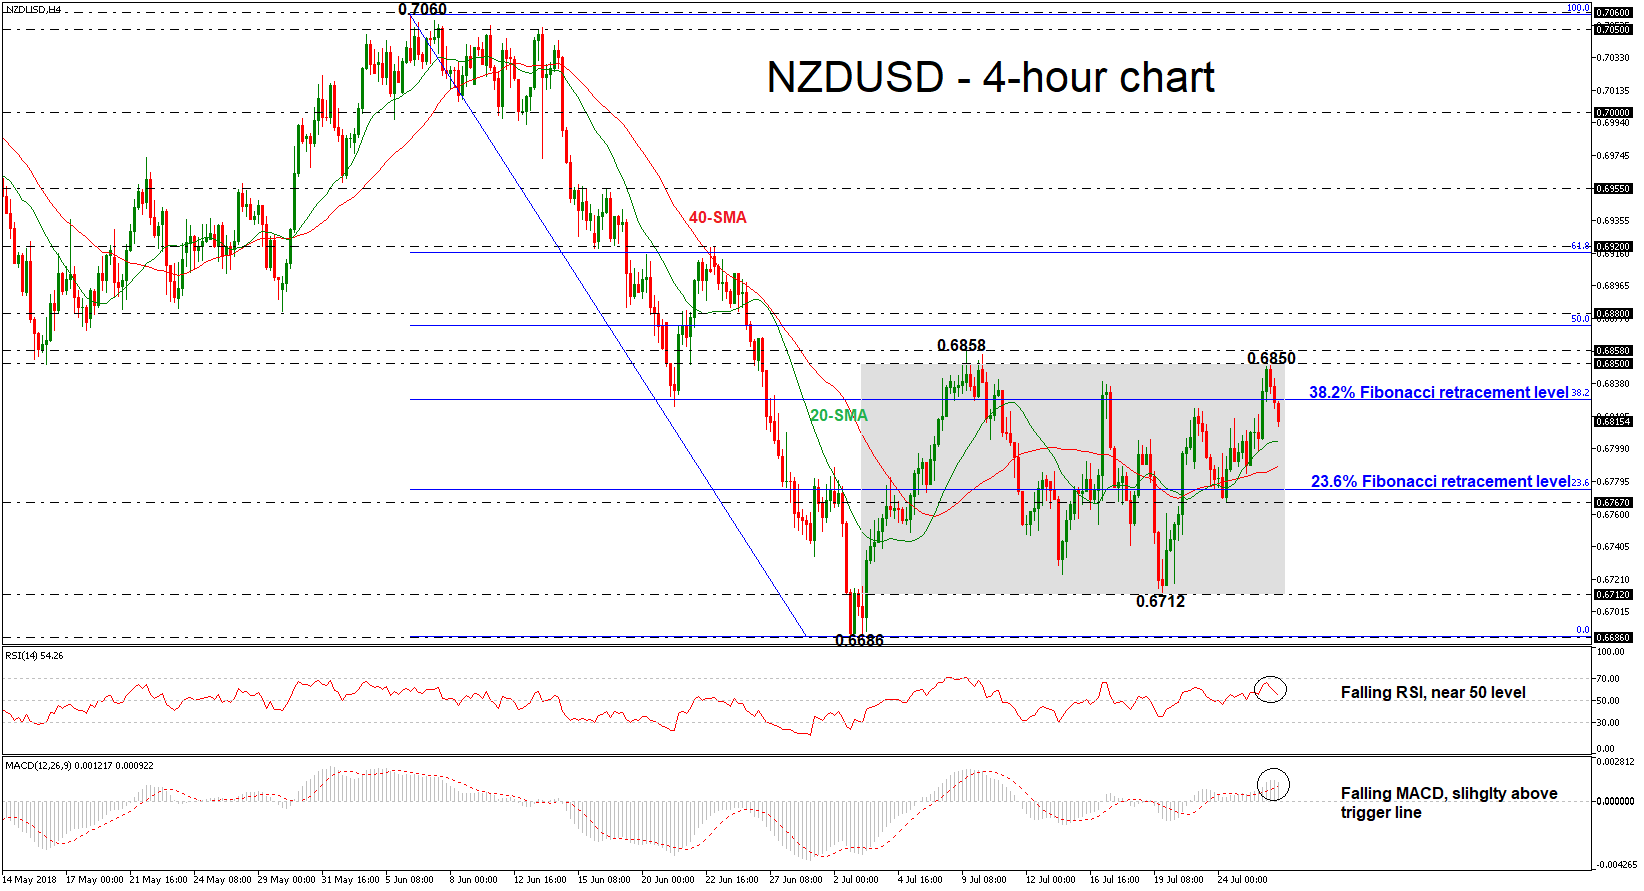
NZDUSD has come under renewed selling pressure, falling back below the 38.2% Fibonacci retracement level of the downleg from 0.7060 to 0.6686, near 0.6828. In the 4-hour chart, the price is set to record the third straight negative session, indicating further declines during the day. Broadly, the pair has been trading within a consolidation area since July 3 with upper boundary the 0.6850 resistance level and lower boundary the 0.6712 support.
Looking at momentum oscillators, they suggest further bearish extensions in the short-term. The RSI indicator is moving south, detecting negative momentum and is also pointing downwards. The MACD oscillator, already negative and is ready to post a bearish crossover with its trigger line.
In case of further declines in the price, immediate support may be found near the 20- and 40- simple moving averages (SMAs) at 0.6803 and 0.6789 respectively. A downside break of these levels would open the way for the 23.6% Fibonacci mark of 0.6774. In addition, if sellers manage to push below that hurdle too, they could drive the price until the 0.6767 support barrier.
On the flip side, if the bulls retake control, price advances may stall initially near the latest high at 0.6850 (upper boundary of the trading range). A potential upside violation of this level is raising the likelihood for more advances until the 0.6858 minor resistance and then towards the 50.0% Fibonacci of 0.6872.
Overall, NZDUSD is struggling in a sideways channel in the near term. A downside penetration of the channel would reinforce the negative medium-term outlook. However, an upside break would weaken the bearish picture.


