
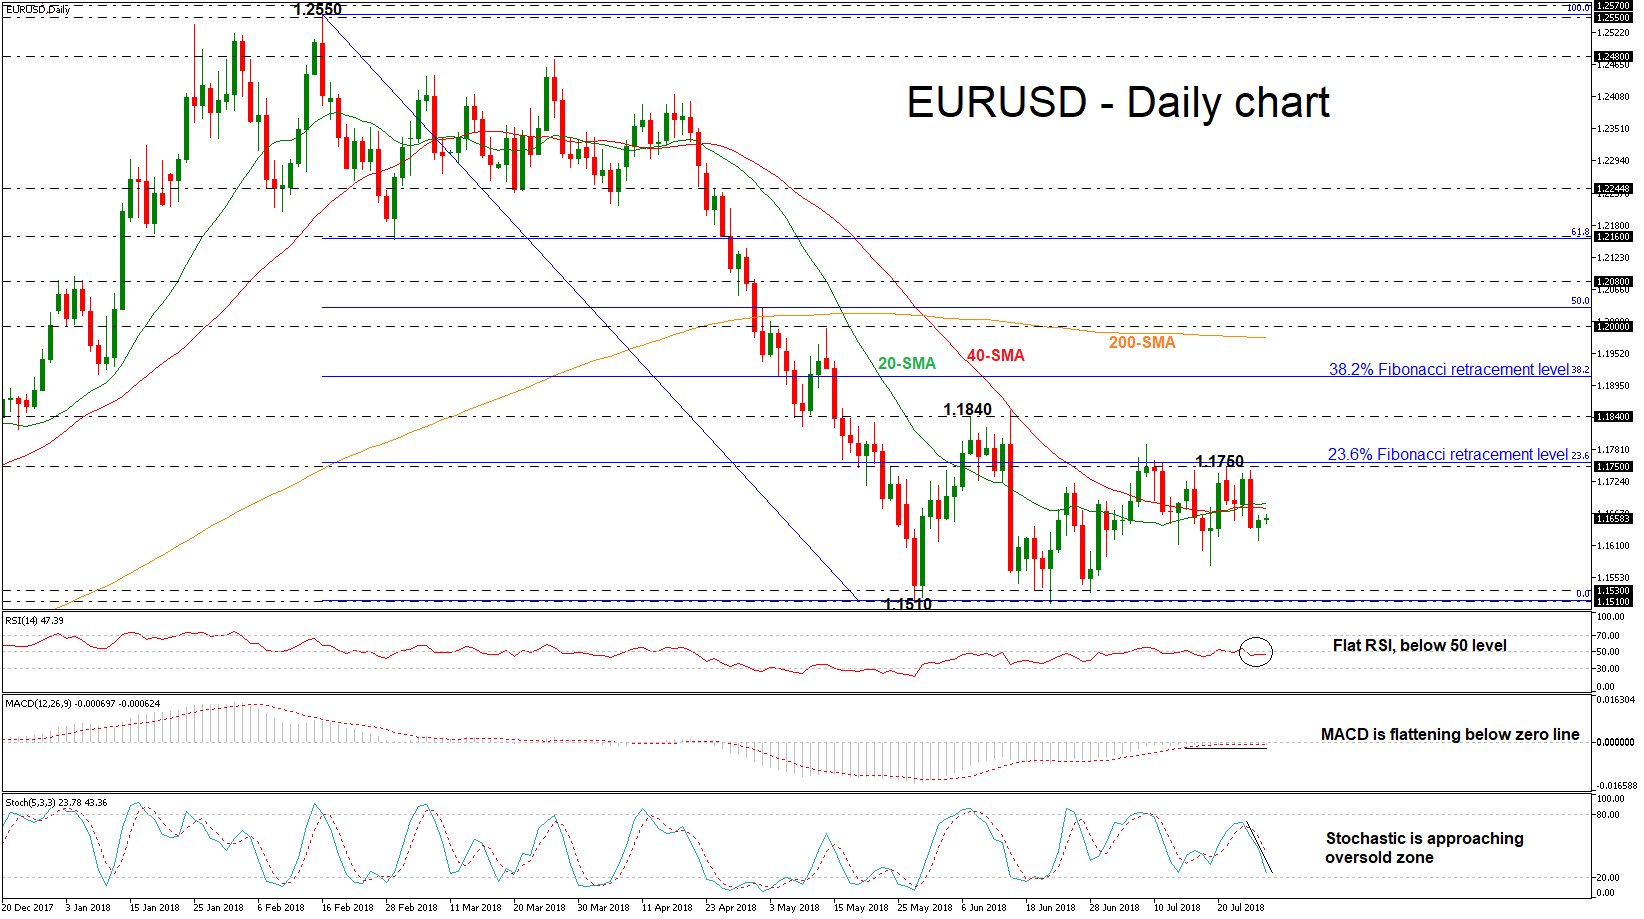
EURUSD has been remaining below the strong resistance obstacle of the 23.6% Fibonacci retracement level near 1.1760 of the downleg from 1.2550 to 1.1510, since June 14. Moreover, the pair trades around the 20- and 40-simple moving averages (SMAs) in the daily timeframe, indicating a possible sideways channel.
Having a look at the technical indicators, the RSI is flattening slightly below the threshold of 50, while the MACD oscillator failed to jump into the positive territory but still stands above the trigger line. However, the stochastic oscillator is moving lower with strong momentum approaching the oversold zone.
A positive rally is likely to find resistance at the aforementioned strong barrier of the 23.6% Fibonacci mark (1.1760) before being able to re-challenge the 1.1840 key level, taken from the June 7 peak. A jump above this area would help shift the focus to the upside towards the 38.2% Fibonacci of 1.1910. Breaking this level could see a touch of the 1.2000 psychological level, which stands slightly above the 200-SMA in the medium-term.
On the other side, if the price remians below the short-term moving averages, the bearish phase would remain in play especially if the price hit again the 1.1510 – 1.1530 support zone. Clearing this area would see additional losses towards the 1.1300 handle, identified by the high on November 2016.
To conclude, EURUSD would be stuck in a trading range in the short term if it hits again the 1.1840 resistance and reverses lower again. Though, a climb above this level could endorse the scenario for a period of gains.


