
The EUR/USD currency pair
Technical indicators of the currency pair:
Prev Open: 1.16417
Open: 1.16570
% chg. over the last day: +0.13
Day’s range: 1.16444 – 1.16727
52 wk range: 1.0571 – 1.2557
On Friday, there was a variety of trends on the EUR/USD currency pair. A report on the US GDP was published, according to which the indicator grew to 4.1% in the second quarter, as experts expected. At the moment, the technical pattern is ambiguous: quotes are in a sideways trend. The key support and resistance levels are 1.16450 and 1.16750, respectively. We recommend opening positions from these marks.
The news feed on 2018.07.30:
German consumer price index at 15:00 (GMT+3:00);
Pending home sales index in the US at 17:00 (GMT+3:00).
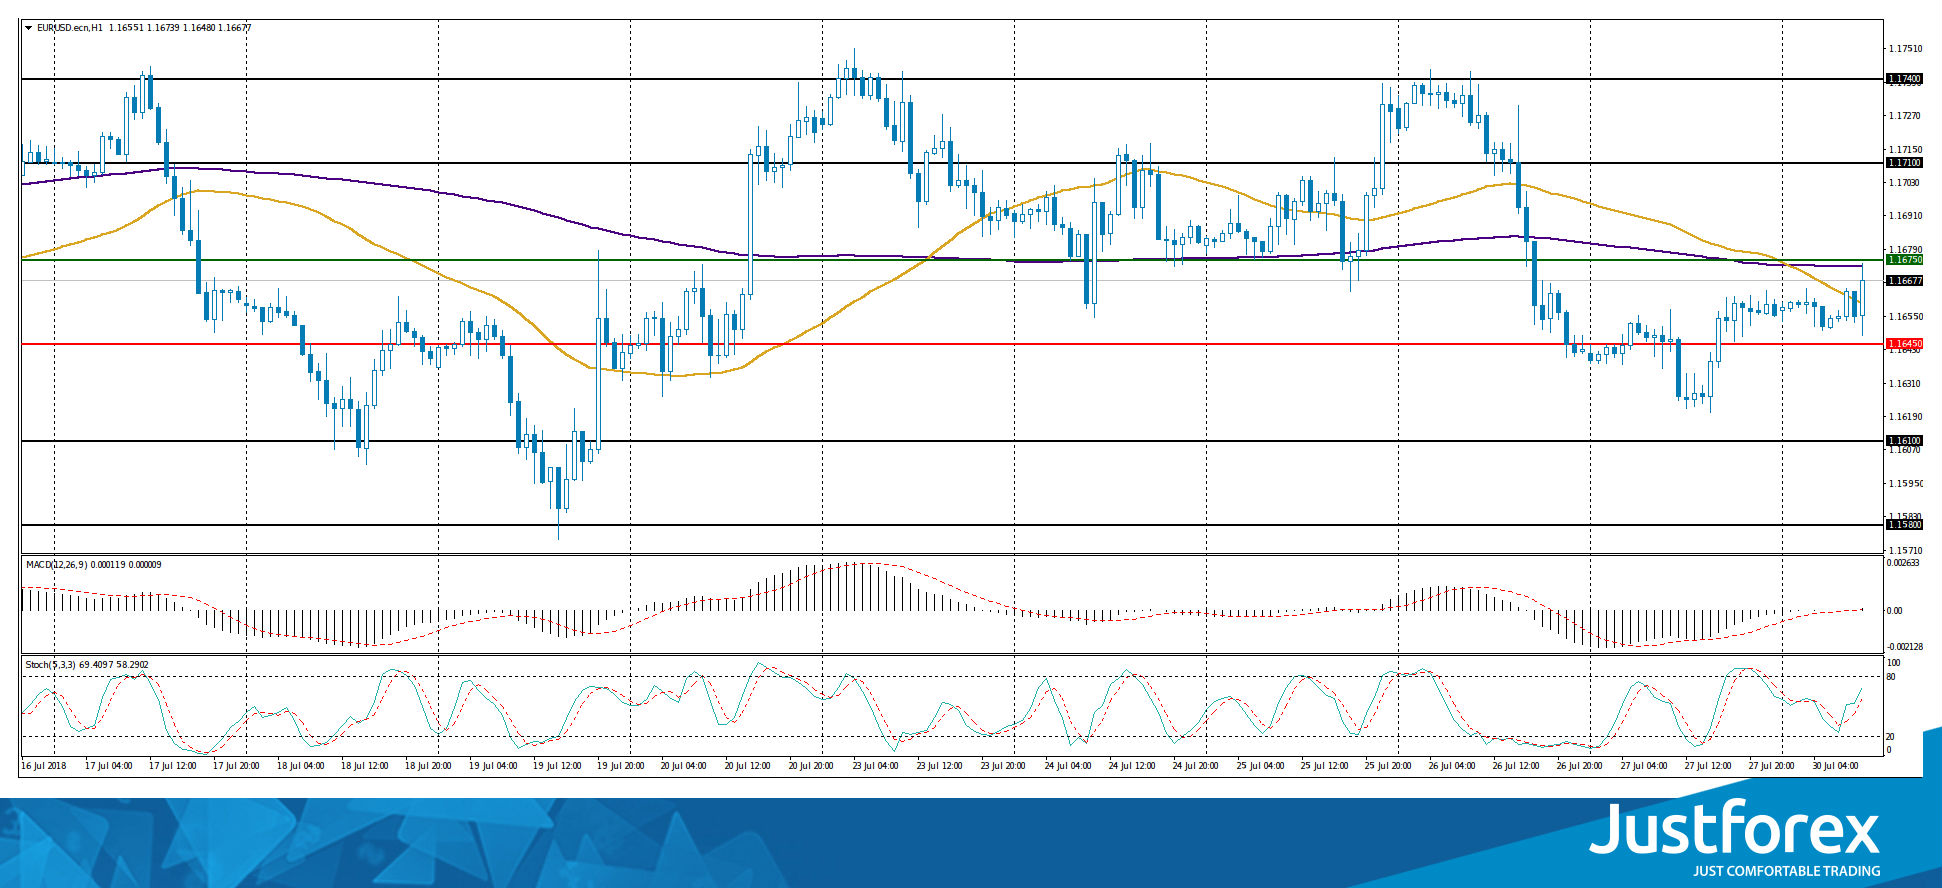
Indicators do not send accurate signals: 50 MA crossed 200 MA.
The MACD histogram is near the 0 mark. There are no accurate signals.
Stochastic Oscillator is in the neutral zone, the %K line is above the %D line, which signals to buy EUR/USD.
Trading recommendations
Support levels: 1.16450, 1.16100, 1.15800
Resistance levels: 1.16750, 1.17100, 1.17400
If the price fixes below 1.16450, we recommend considering sales of EUR/USD. The movement is tending to 1.16100-1.15800.
Alternative option. If the price fixes above the resistance level of 1.16750, the EUR/USD quotes are expected to rise. The movement is tending to 1.17100-1.17400.
The GBP/USD currency pair
Technical indicators of the currency pair:
Prev Open: 1.31075
Open: 1.31090
% chg. over the last day: +0.05
Day’s range: 1.30927 – 1.31196
52 wk range: 1.2361 – 1.4345
The technical pattern on the GBP/USD currency pair is ambiguous. Quotes are moving in flat. Investors expect additional drivers. At the moment, the local support and resistance levels are still 1.31000 and 1.31400, respectively. The positions should be opened from these marks.
Today, the publication of important news from the UK is not expected.
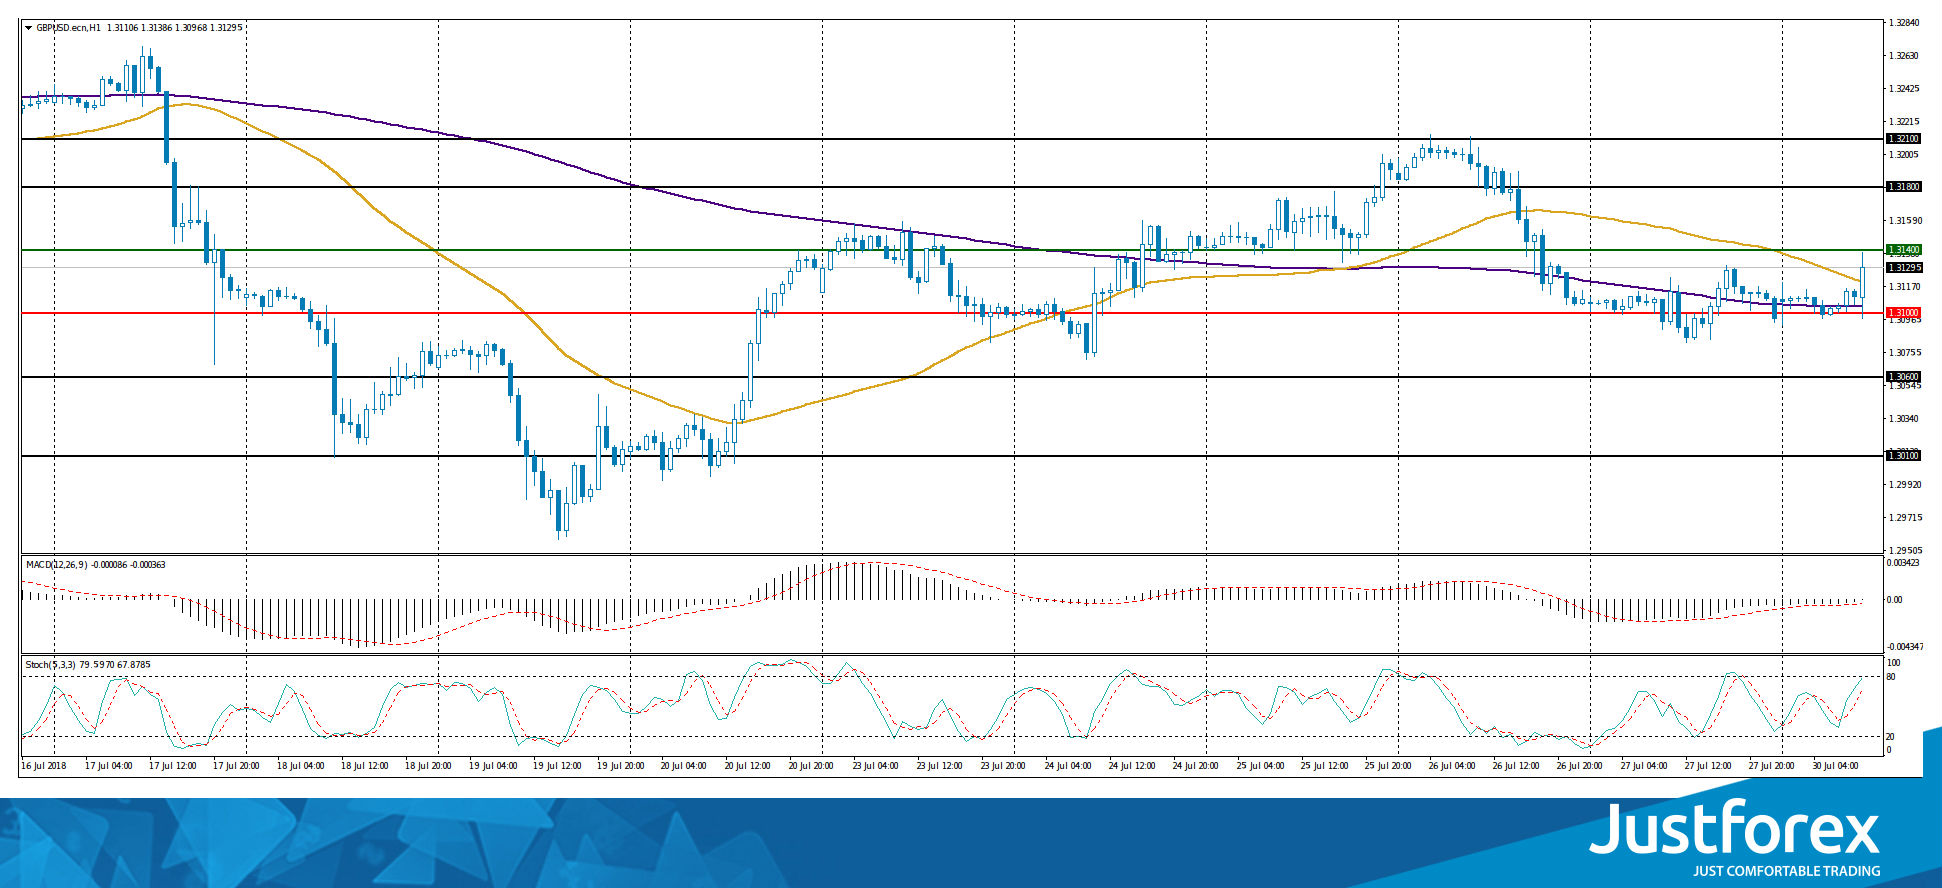
The price has fixed above 50 MA and 200 MA, which indicates the power of buyers.
The MACD histogram is near the 0 mark.
Stochastic Oscillator is located near the overbought zone, the %K line is above the %D line, which gives a signal to buy GBP/USD.
Trading recommendations
Support levels: 1.31000, 1.30600, 1.30100
Resistance levels: 1.31400, 1.31800, 1.32100
If the price fixes above 1.31400, we recommend considering purchases of GBP/USD. The movement is tending to 1.31800-1.32100.
Alternative option. If the price fixes below the round level of 1.31000, the GBP/USD currency pair is expected to decline. The movement is tending to 1.30600-1.30300.
The USD/CAD currency pair
Technical indicators of the currency pair:
Prev Open: 1.30708
Open: 1.30515
% chg. over the last day: -0.16
Day’s range: 1.30505 – 1.30601
52 wk range: 1.2059 – 1.3795
The USD/CAD currency pair is in a sideways trend. Investors expect additional drivers. The key support and resistance levels are 1.30500 and 1.30800, respectively. The positions should be opened from these marks. We recommend paying attention to the dynamics of oil quotes.
The news feed on the economy of Canada is calm.
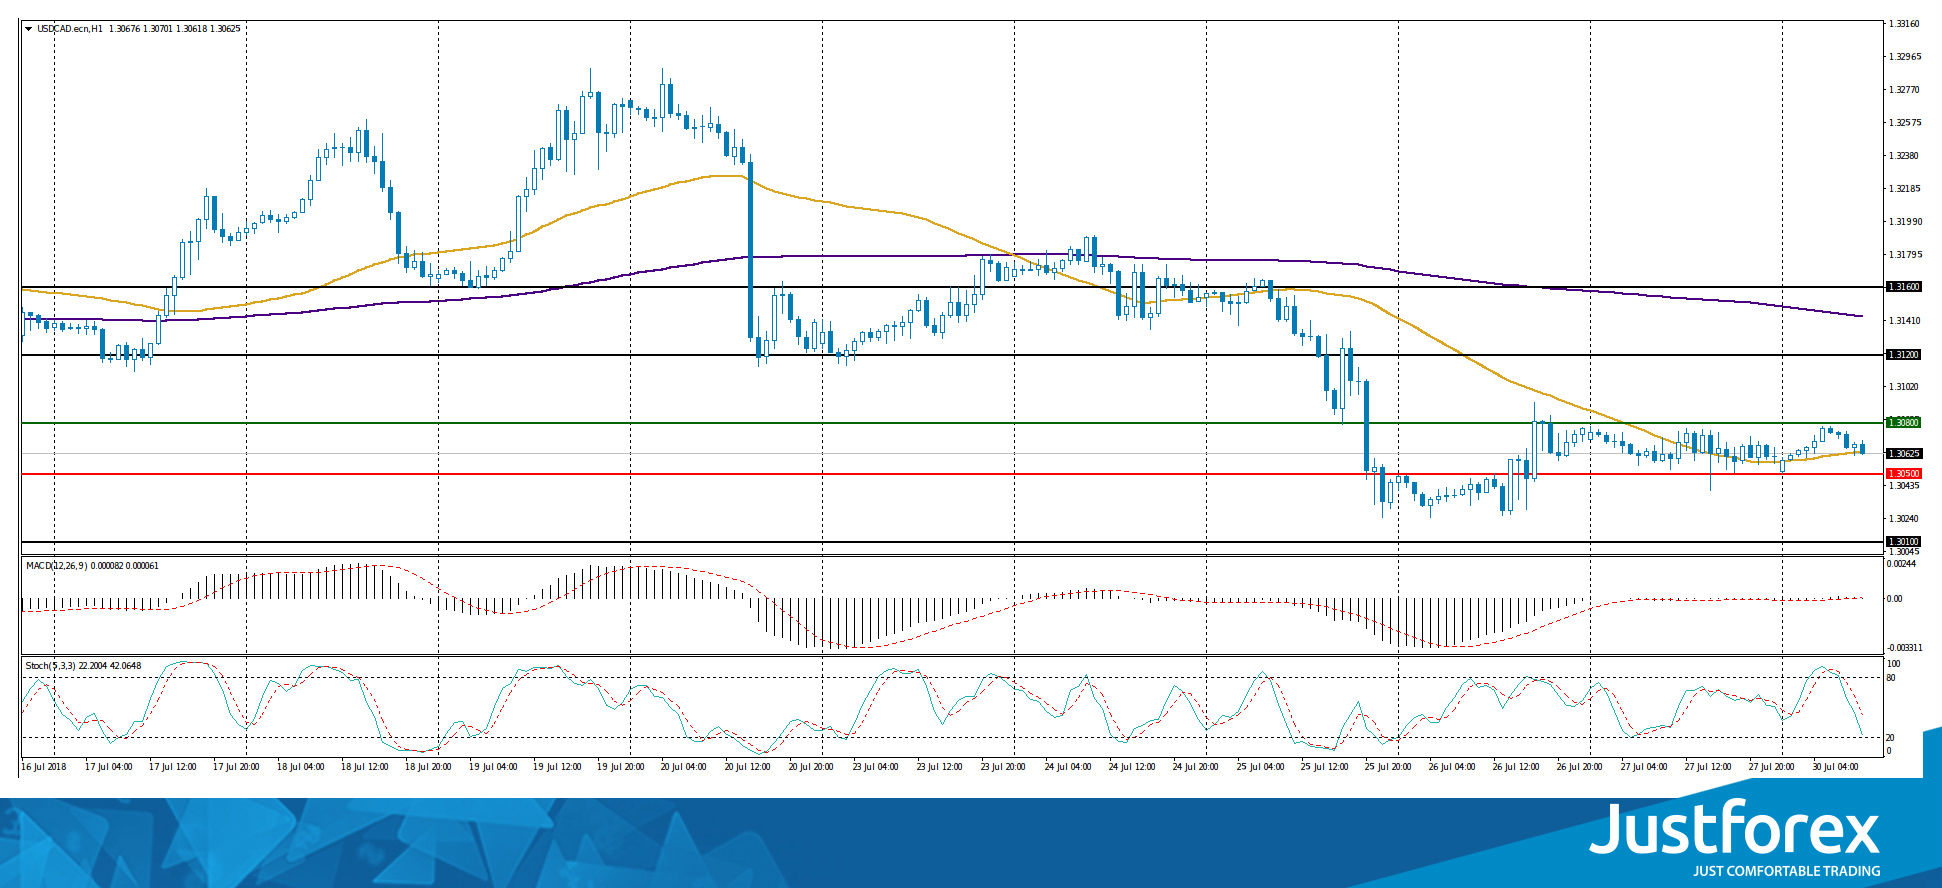
Indicators do not send accurate signals: the price is testing 50 MA.
The MACD histogram is near the 0 mark. There are no signals.
Stochastic Oscillator is in the neutral zone, the %K line is below the %D line, which gives a signal to sell USD/CAD.
Trading recommendations
Support levels: 1.30500, 1.30100
Resistance levels: 1.30800, 1.31200, 1.31600
If the price fixes below the support level of 1.30500, we recommend considering sales of USD/CAD. The movement is tending to 1.30100-1.29800.
If the price fixes above 1.30800, it is necessary to look for entry points to the market to open long positions. The target movement level is 1.31200-1.31400.
The USD/JPY currency pair
Technical indicators of the currency pair:
Prev Open: 111.219
Open: 110.936
% chg. over the last day: -0.15
Day`s range: 110.919 – 110.994
52 wk range: 104.56 – 114.74
The technical pattern on the USD/JPY currency pair is ambiguous. Quotes are in a sideways trend. Investors expect additional drivers. The key support and resistance levels are 110.900 and 111.200, respectively. The positions should be opened from these marks. We recommend paying attention to the 10-year US government bonds yield.
The news feed on the economy of Japan is calm.
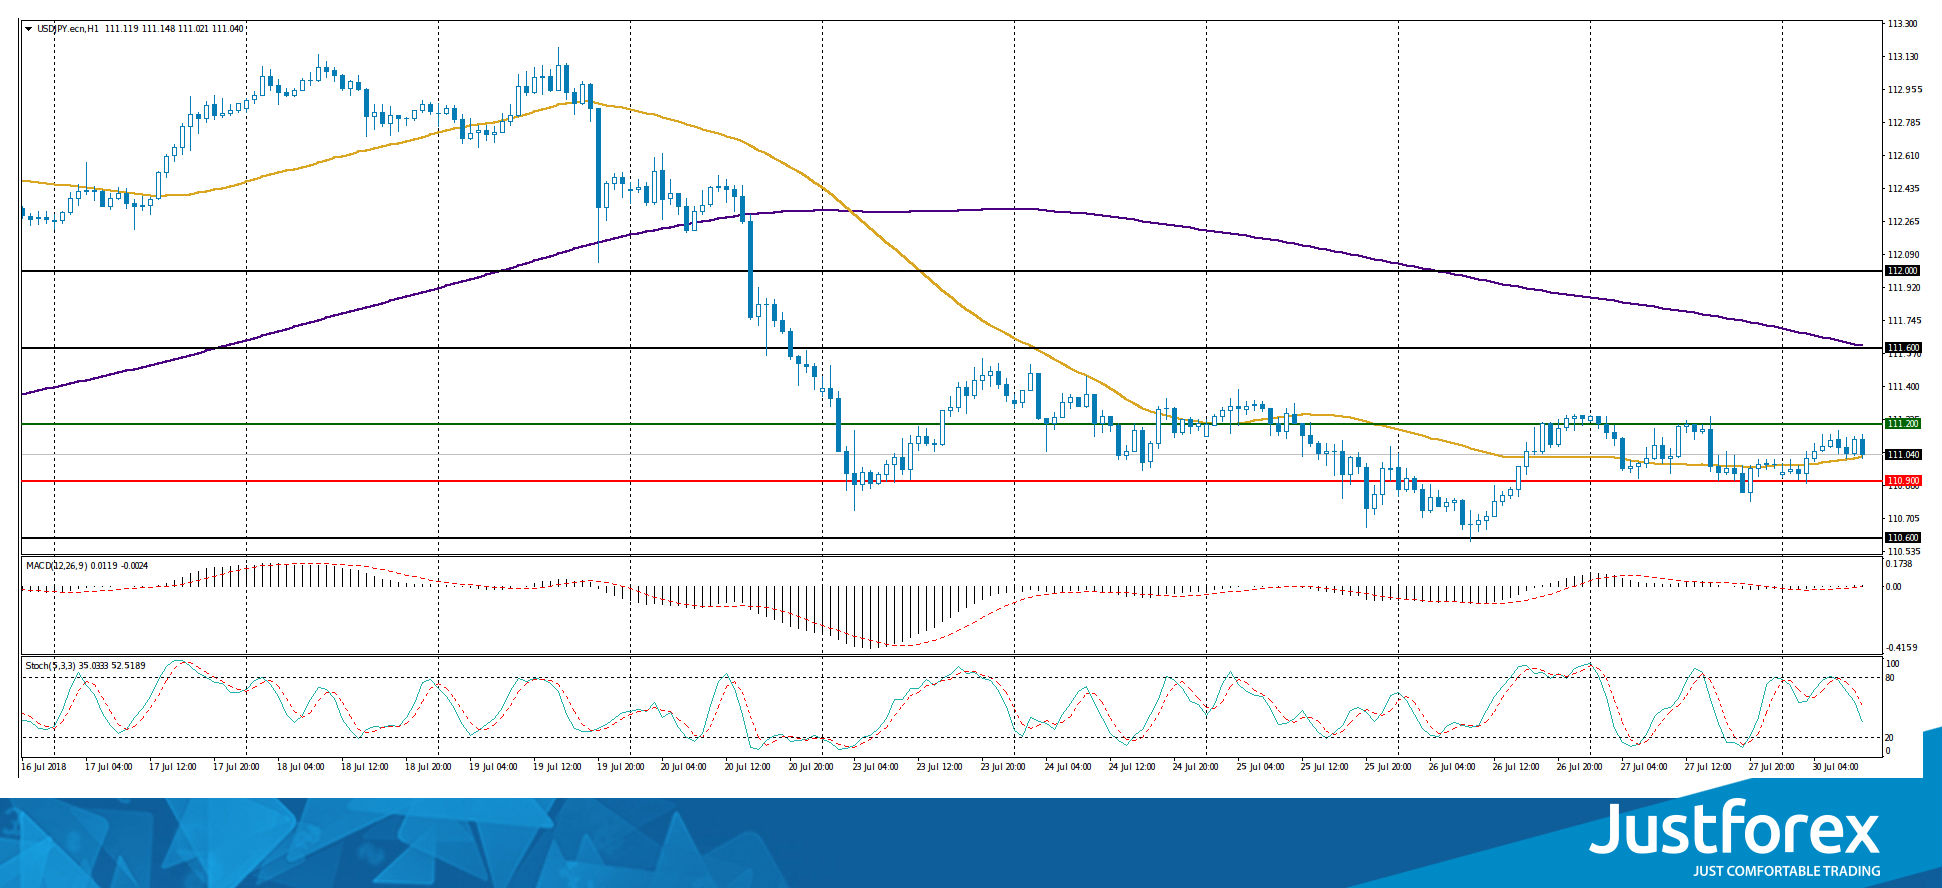
Indicators do not send accurate signals: the price is testing 50 MA.
The MACD histogram is near the 0 mark.
Stochastic Oscillator is located in the neutral zone, the %K line is below the %D line, which indicates a decrease in quotes.
Trading recommendations
Support levels: 110.900, 110.600
Resistance levels: 111.200, 111.600, 112.000
If the price fixes below the support of 110.900, the USD/JPY currency pair is expected to decline. The movement is tending to 110.600-110.300.
Alternative option. If the price fixes above the level of 111.200, it is necessary to consider purchases of USD/JPY. The movement is tending to 111.600-111.800.


