
Key Highlights
- The US Dollar remains in a short-term downtrend below the 111.50 pivot level against the Japanese Yen.
- There is a declining channel forming with resistance near 111.20 on the 4-hours chart of USD/JPY.
- The US Initial Jobless Claims for the week ending August 11, 2018 declined from 214K to 212K.
- Today, the Euro Zone CPI figure for July 2018 will be released, which is forecasted to rise 2.1% (YoY).
USDJPY Technical Analysis
The US Dollar recovered recently after trading to a new monthly low at 110.10 against the Japanese Yen. The USD/JPY pair corrected above 111.00, but it failed to move above the 111.50 pivot zone.
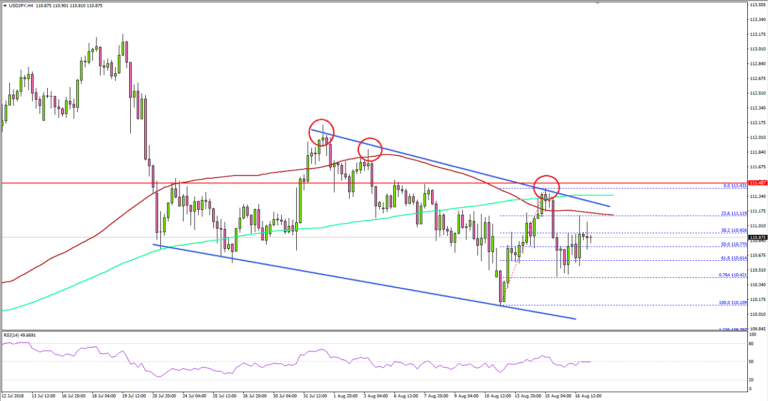
Looking at the 4-hours chart, the pair failed near the 111.40-50 zone and the 200 simple moving average (green, 4-hours). It declined below 111.00 and the 50% Fib retracement level of the last wave from the 110.10 low to 111.41 high.
On the downside, the 110.40 level is a decent support since it is the 76.4% Fib retracement level of the last wave from the 110.10 low to 111.41 high. Below 110.40, the pair could retest the last low at 110.10.
On the upside, the 111.10-20 zone is a major hurdle for buyers along with the 100 SMA (red, 4-hours). More importantly, there is a declining channel forming with resistance near 111.20 on the same chart.
Therefore, a break and close above 111.20 and 111.50 may well open the doors for a bullish wave towards 112.00 and 112.20. On the flip side, a break below 110.10 will most likely lead the pair towards 109.60.
Recently, the US Initial Jobless Claims figure for the week ending August 11, 2018 was released by the US Department of Labor. The market was looking for a rise from the last reading of 213K to 215K.
The actual result was positive as there was a decline in claims from the last revised reading of 214K to 212K. The report added that:
The 4-week moving average was 215,500, an increase of 1,000 from the previous week’s revised average. The previous week’s average was revised up by 250 from 214,250 to 214,500.
Overall, the US Dollar traded higher versus the Euro and the British Pound, but it struggled to gain momentum against the Japanese Yen.
Economic Releases to Watch Today
- Euro Zone CPI for July 2018 (YoY) – Forecast +2.1%, versus +2.1% previous.
- Euro Zone CPI for July 2018 (MoM) – Forecast -0.3%, versus +0.1% previous.
- Canadian Consumer Price Index July 2018 (MoM) – Forecast +0.1%, versus +0.1% previous.
- Canadian Consumer Price Index July 2018 (YoY) – Forecast +2.5%, versus +2.5% previous.


