
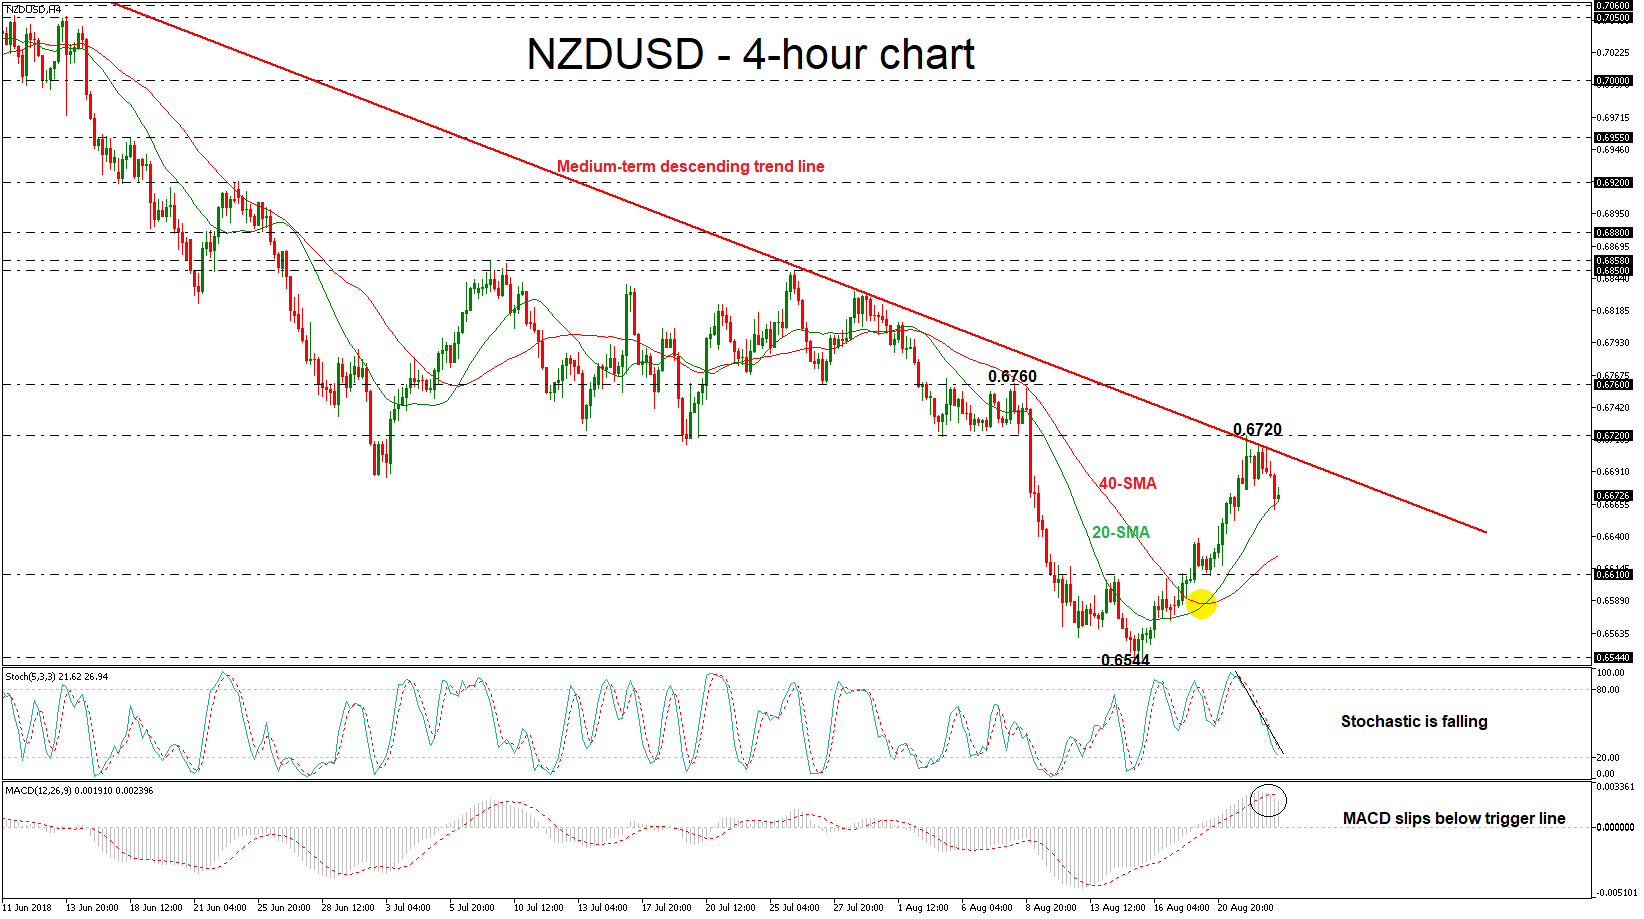
NZDUSD has been creating a pullback since yesterday after it challenged the medium-term descending trend line near the 0.6720 resistance level. However, the pair has found immediate support at the 20-simple moving average (SMA) in the 4-hour chart and the technical indicators are focusing for bearish movements as well.
Looking at the near-term picture, the stochastic oscillator is heading sharply lower towards the oversold zone, while the MACD oscillator has dived below the trigger line with strong momentum. However, the price holds above the moving averages with the bullish crossover still standing.
Should the pair manage to strengthen its negative momentum and drop below the 20-SMA, the next resistance could come from the 40-SMA at 0.6625 and then the price could hit the 0.6610 support barrier. The next key support to watch lower is the two-and-a-half-year low of 0.6544, identified by the trough on August 15.
However, in the case of an upward attempt in the next few sessions, the short-term risk would shift back to the upside, with the downtrend line and the 0.6720 resistance coming into focus again. Above these levels, the bullish picture would be endorsed and the next resistance for investors to have in mind is the 0.6760.
Regarding the longer timeframe, the pair has been developing within a bearish movement since April 13 and this would change in case of a significant bullish rally above this line.


