
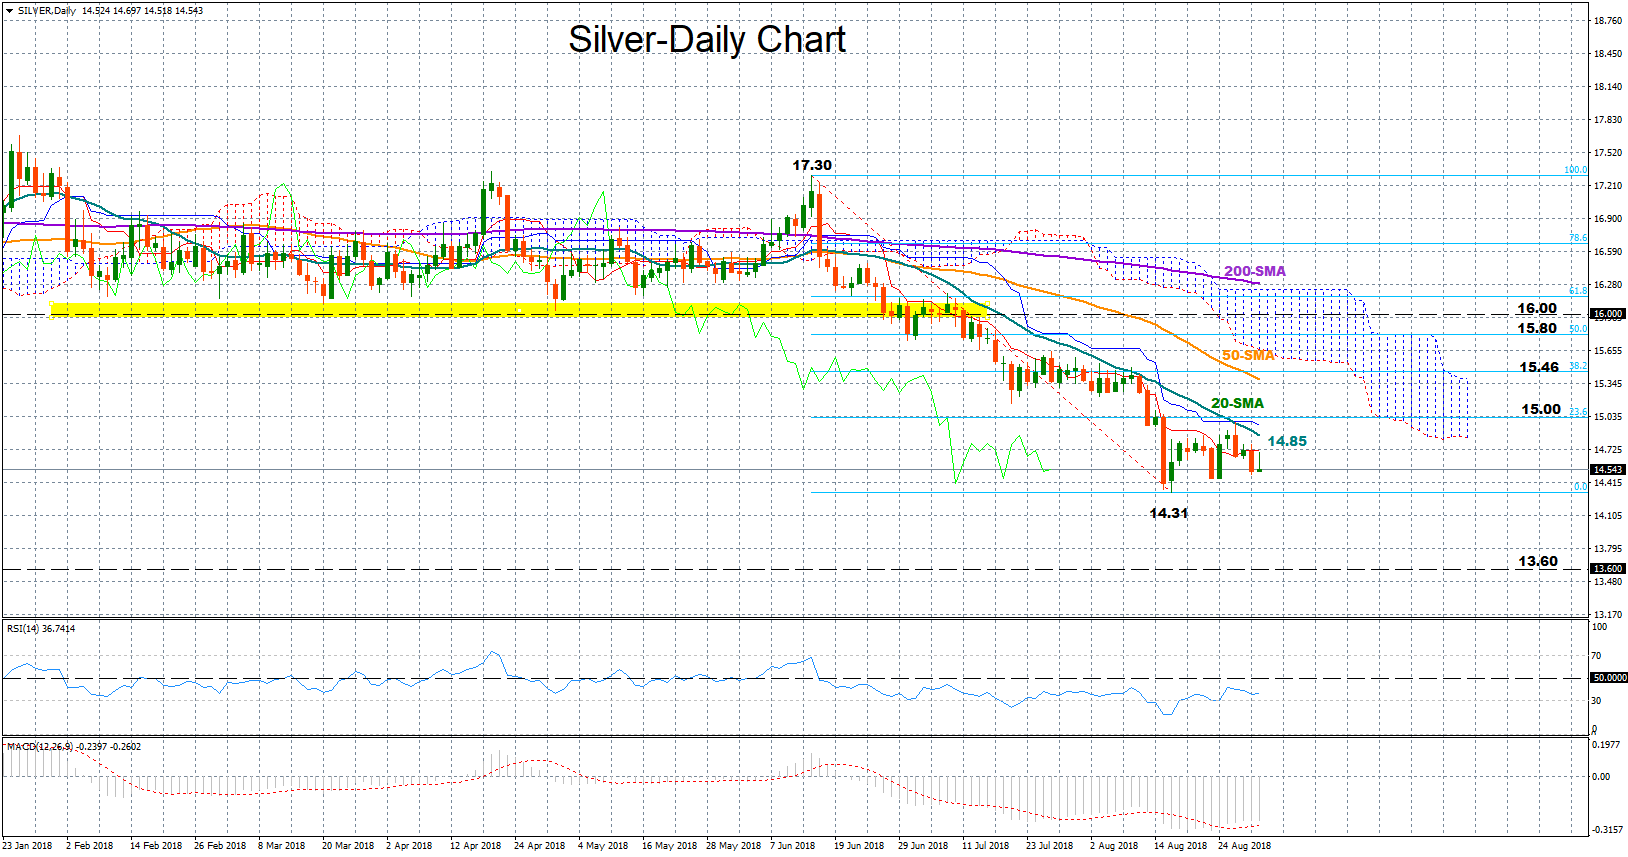
Silver turned increasingly bearish after it dropped below the 16.00 key-level, the bottom of its range-bound trading recorded between early February and mid-June, printing lower lows and lower highs until it reached one-year lows at 14.31 on August 16. Since then, the market has been moving sideways, with the RSI and the MACD supporting that chances for a bull market are minimal in the short-term; the RSI is negatively sloped below 50 and the MACD holds steady marginally above its red signal line and far below zero.
If the price extends to the downside, support may come between 14.31 and the July 2017 trough of 14.28. A failure to hold above that zone could send the market down to 13.60, a level last seen in December 2015, while steeper declines could also unlock the 13.00 psychological mark before reaching 12.00, a frequently tested area during 2008-2009.
On the flip side, a correction to the upside could quickly meet the 20-day simple moving average currently at 14.85, ahead of the 23.6% Fibonacci of the downleg from 17.30 to 14.30, at 15.00. Further up, bullish actions could try to close the day above the 38.2% Fibonacci of 15.46, seen as a strong resistance during the past couple of weeks. Even higher and above the 50% Fibonacci of 15.80, traders could confirm the start of an uptrend.
In the bigger picture, silver is trading bearish below the Ichimoku cloud and under all its negatively-sloped moving averages.


 Looking to Extend Higher in a Nest")


