
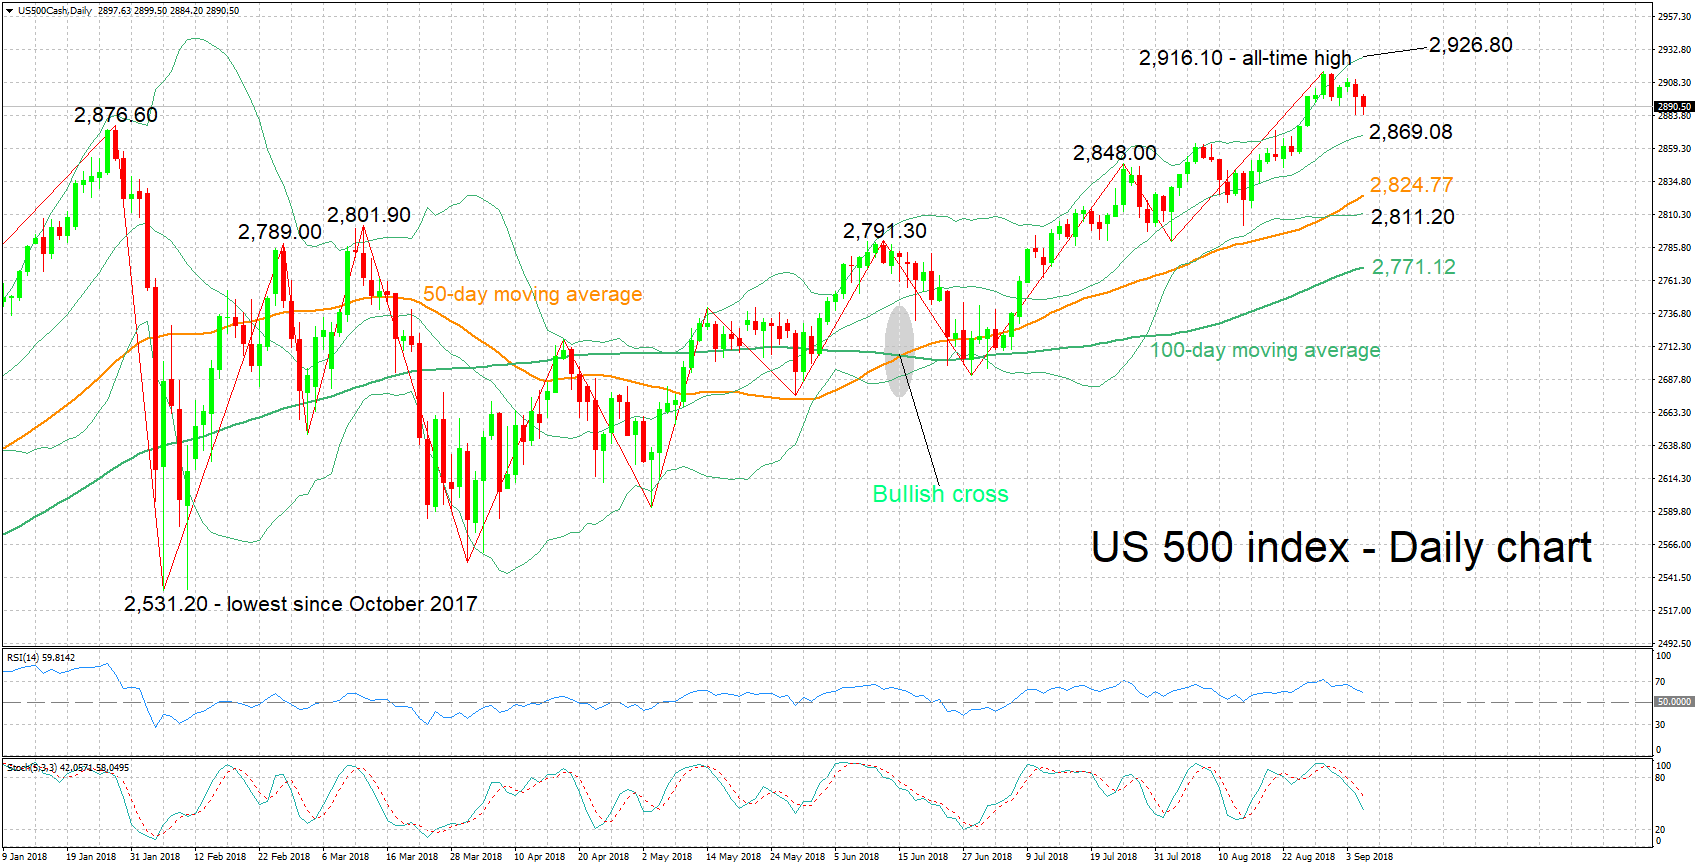
The US 500 index has declined after touching an all-time high of 2,916.50 on August 29. Still, the benchmark continues to trade relatively close to its record peak.
The RSI has reversed lower after entering overbought territory last week and continues to head down, supporting the view that near-term momentum has turned negative. The stochastics are also projecting a bearish picture in the very short-term: the %K and %D lines are negatively aligned and are moving lower.
A move back to the upside may meet resistance around the record high of 2,916.50 from the previous week. The zone around this includes the 2,900 round figure, as well as the upper Bollinger band at 2,926.80. Further above and into uncharted territory, the region around the 3,000 mark may act as a barrier to price gains, with a violation possibly fueling bullish sentiment and thus a sharp move up.
On the downside, support could come around the middle Bollinger line – a 20-day moving average line – at 2,869.08. Notice that the area around this encapsulates a couple of top from previous months. Steeper losses would turn the attention to the current level of the 50-day MA at 2,824.77, with the lower Bollinger band lying not far below at 2,811.20.
The medium-term outlook is undoubtedly bullish: the index is in an uptrend recording higher highs and higher lows and price action is taking place above both the 50- and 100-day MA lines.
Overall, the short-term bias appears to have turned negative, while the medium-term picture remains positive.


