
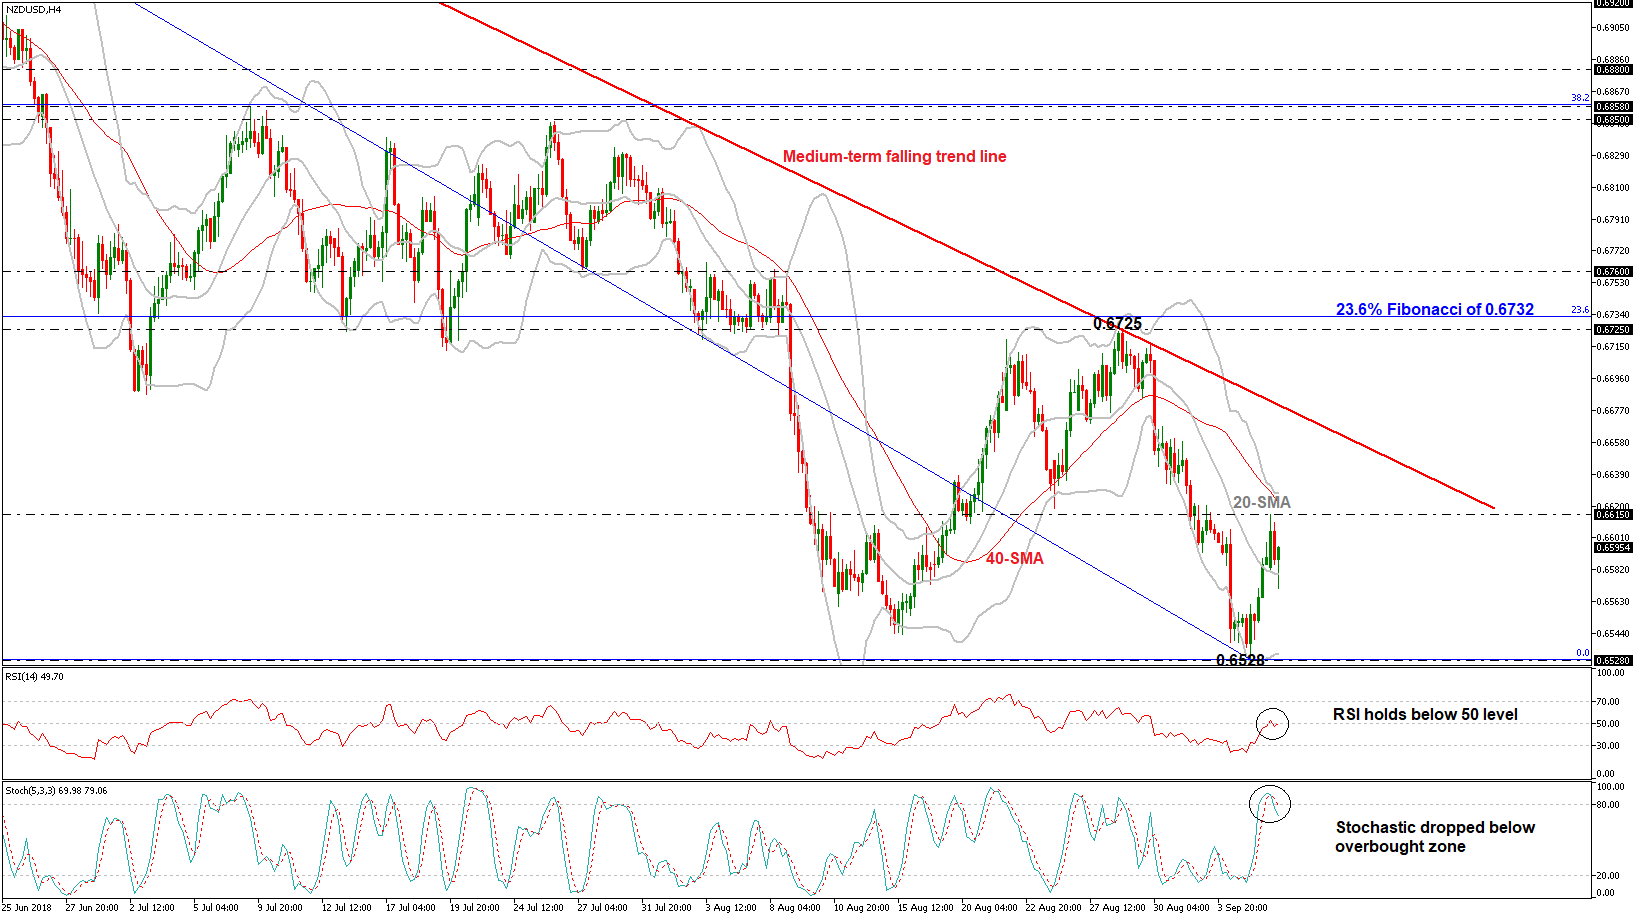
NZDUSD has declined in the previous session in the 4-hour chart but still remains above the mid-level of the Bollinger Band, this being a 20-period simple moving average (SMA). The RSI seems to be stalling its advance below the 50 neutral-perceived level, while the stochastic oscillator is giving a bearish signal in the very short-term as the %K line has crossed below the %D line, with both heading lower.
Should the pair stretch south, Wednesday’s 2½-year low of 0.6528 could provide immediate support before the January 2016 bottom of 0.6345 come into view. The round figures of 0.6500 and 0.6400 may hold psychological importance, providing some support before the aforementioned nadir is eyed.
On the flip side, the 0.6615 resistance barrier which is marginally below the upper Bollinger Band may halt upside movements. In case of a run above, the medium-term descending trend line near 0.6700 could also provide resistance. Such a move would also violate the diagonal line, confirming the start of a bullish correction and could drive the pair until 0.6725 which stands near the 23.6% Fibonacci retracement level of the downleg from 0.7390 to 0.6528.
In the medium-term, NZDUSD has been trading bearish in the past four months after the pullback on the 0.7390 hurdle.


