
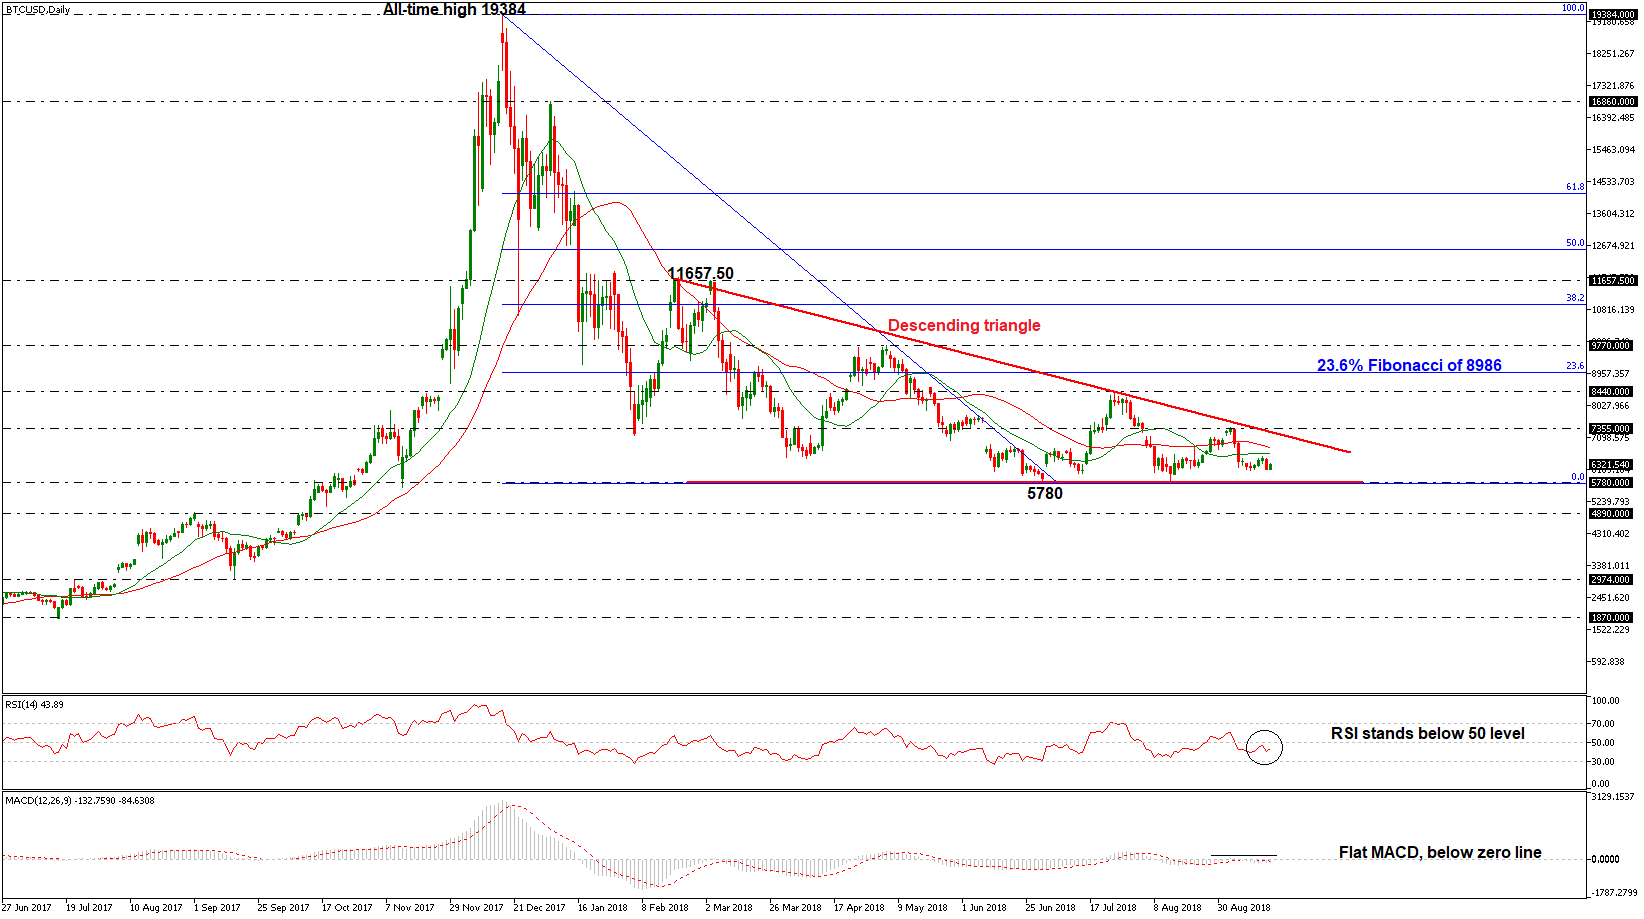
BTCUSD has been trading within a descending triangle pattern over the last seven months, with a strong support obstacle being the 5780 barrier. Moreover, the price started an aggressive bearish structure after the pullback from the all-time high of 19384 reached in December 2017 That said, technical oscillators paint a somewhat neutral picture currently.
In the short-term, the RSI indicator is sloping slightly to the upside near the neutral threshold of 50, while the MACD oscillator is flattening around its trigger and zero lines, indicating that the pattern may stay in place for the next few sessions.
Should the pair stretch south and dip below the significant support of 5780, the next level for investors to have in mind is the 4890 hurdle, taken from the high of September 2017. A step lower could enhance bearish sentiment, sending the price probably towards 2974, identified by the low of September 2017.
On the flip side, the 20- and 40-simple moving averages (SMAs) are acting as resistances at 6634 and 6808 respectively at the time of writing. If the bulls take the reins, BTCUSD could rise until the 7355 resistance level, which overlaps with the descending trend line. Steeper increases could also touch the 8440 barrier, before being able to challenge the 23.6% Fibonacci retracement level of the downleg from 19384 to 5780, around 8986.
In the medium-term picture, the price remains in a bearish mode as it holds in a descending reversal pattern and below the moving averages. This pattern suggests that the next move could be to the downside rather than to the upside.


