
The EUR/USD currency pair
Technical indicators of the currency pair:
Prev Open: 1.17479
Open: 1.17654
% chg. over the last day: +0.13
Day’s range: 1.17580 – 1.17683
52 wk range: 1.0571 – 1.2557
The technical pattern on the EUR/USD currency pair is ambiguous. The trading instrument is in a sideways trend. Investors took a wait-and-see attitude before the Fed’s decision on the interest rate. Local support and resistance levels are: 1.17500 and 1.17800, respectively. We recommend opening positions from the key levels.
The news feed on 2018.09.26:
New home sales in the US at 17:00 (GMT+3:00);
Fed interest rate decision at 21:00 (GMT+3:00).
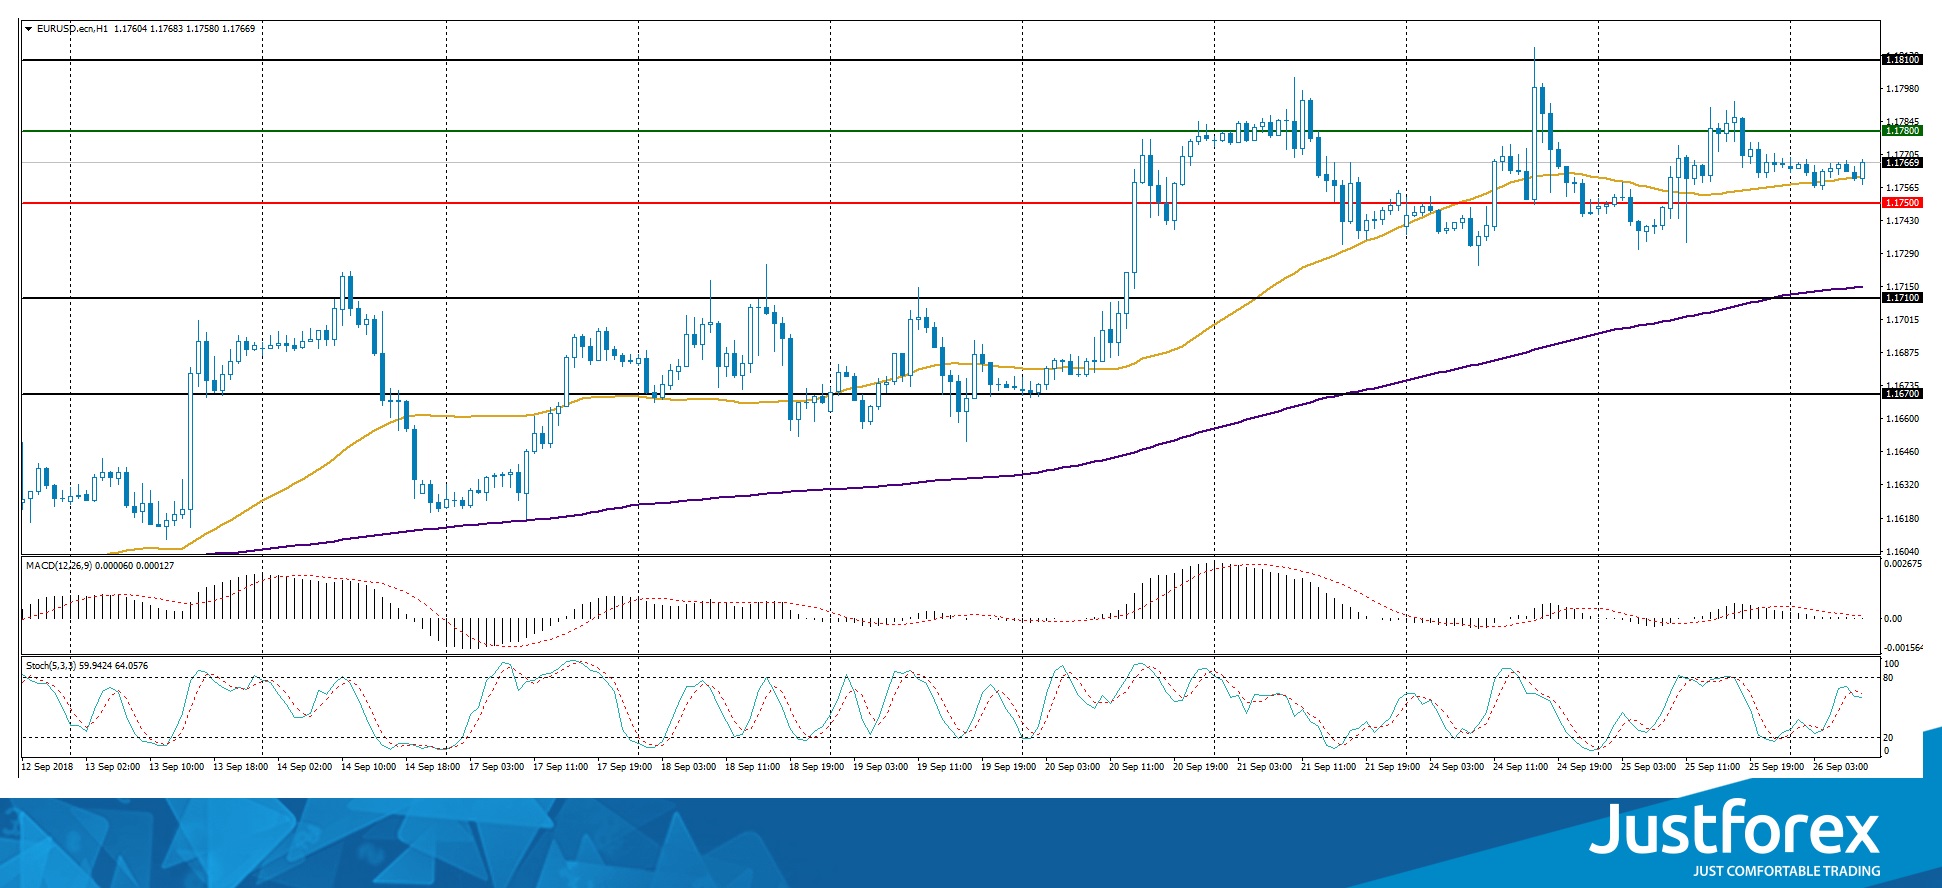
Indicators do not send accurate signals. The price has crossed 50 MA.
The MACD histogram is near the 0 mark.
Stochastic Oscillator is located in the neutral zone, the %K line has crossed the %D line. There are no signals.
Trading recommendations
Support levels: 1.17500, 1.17100, 1.16700
Resistance levels: 1.17800, 1.18100
If the price fixes above the resistance level of 1.17800, the EUR/USD quotes are expected to rise. The movement is tending to 1.18250-1.18500.
An alternative may be the decrease of the EUR/USD currency pair to 1.17100-1.16700.
The GBP/USD currency pair
Technical indicators of the currency pair:
Prev Open: 1.31191
Open: 1.31778
% chg. over the last day: +0.45
Day’s range: 1.31682 – 1.31751
52 wk range: 1.2361 – 1.4345
Yesterday, the bullish sentiment was observed on the GBP/USD currency pair. The growth of quotes exceeded 60 points. At the moment, the technical pattern is ambiguous. Investors expect additional drivers. The key support and resistance levels are 1.31500 and 1.32000, respectively. We recommend opening positions from these marks.
The news feed on the UK economy is calm.
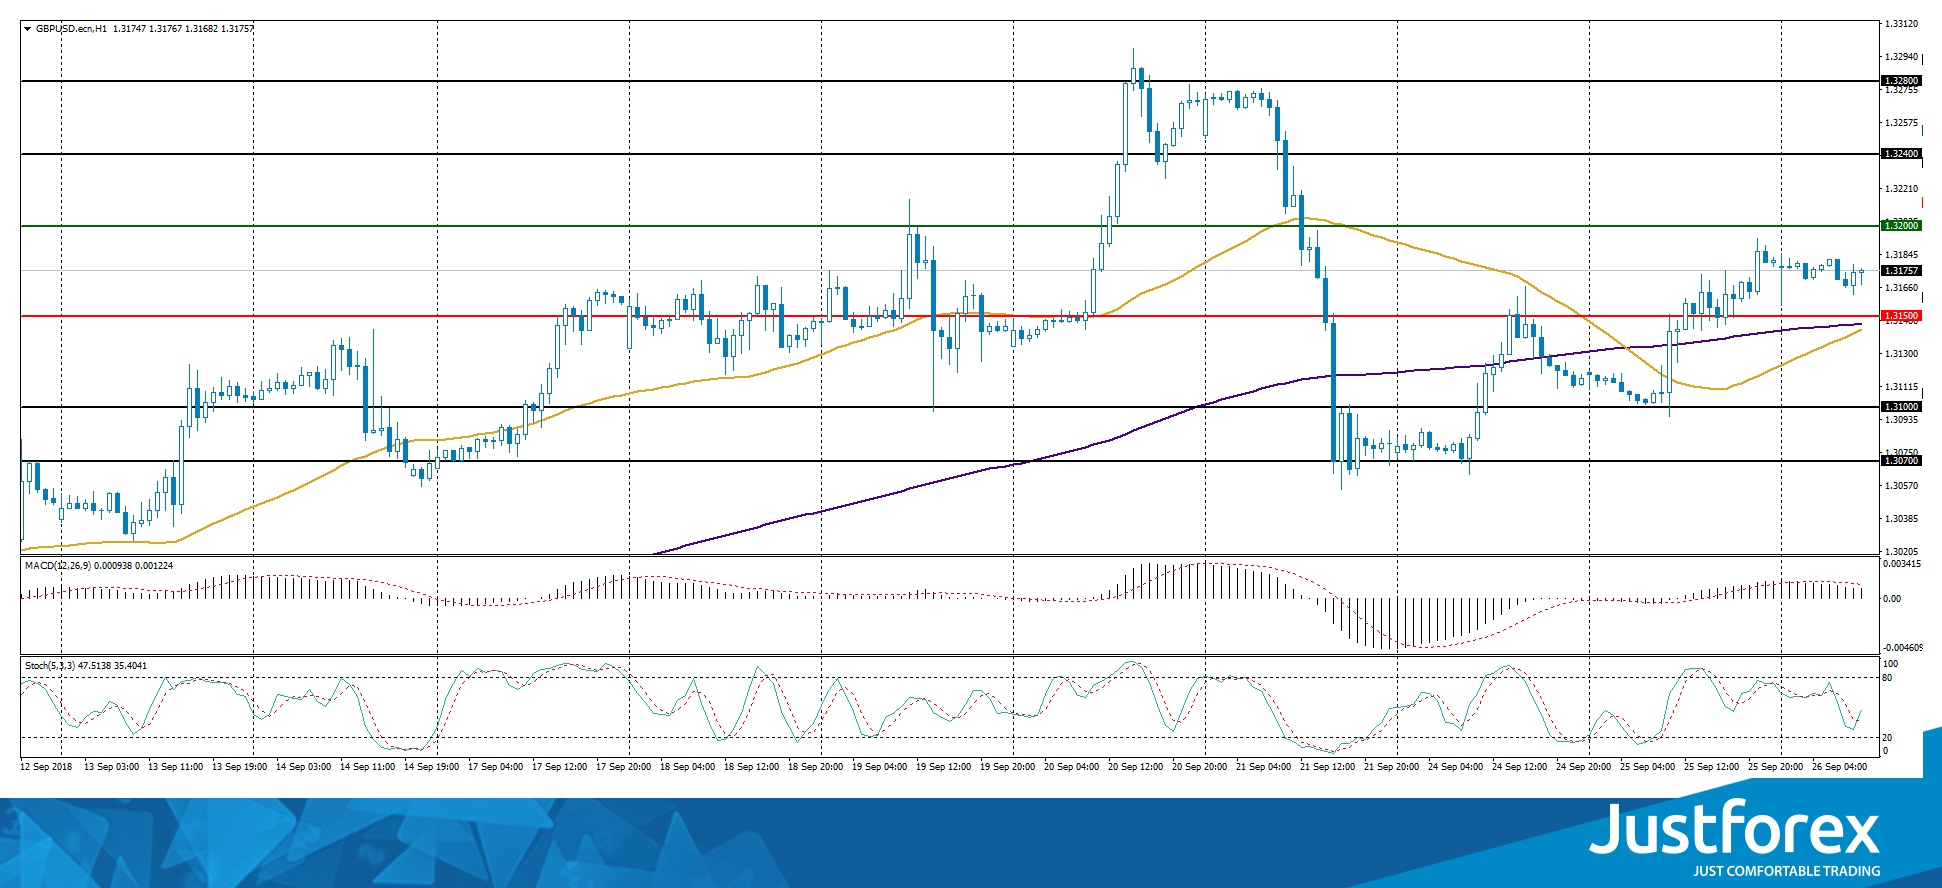
Indicators do not send accurate signals: 50 MA has crossed 200 MA.
The MACD histogram is located in the positive zone, but below the signal line, which gives a weak signal to buy GBP/USD.
Stochastic Oscillator is in the neutral zone, the %K line has crossed the %D line. There are no signals.
Trading recommendations
Support levels: 1.31500, 1.31000, 1.30700
Resistance levels: 1.32000, 1.32400, 1.32800
If the price fixes below 1.31500, the GBP/USD quotes are expected to decline. The movement is tending to 1.31000-1.30700.
Alternative option. If the price fixes above the round level of 1.32000, we recommend considering purchases of GBP/USD. The target movement level is 1.32400-1.32800.
The USD/CAD currency pair
Technical indicators of the currency pair:
Prev Open: 1.29544
Open: 1.29498
% chg. over the last day: +0.01
Day’s range: 1.29507 – 1.29581
52 wk range: 1.2059 – 1.3795
The technical pattern on the USD/CAD currency pair is ambiguous. Quotes are in a sideways trend. Investors expect additional drivers. The key support and resistance levels are 1.29400 and 1.29650, respectively. The positions should be opened from these marks. We recommend paying attention to the US news feed.
The news feed on the economy of Canada is calm.
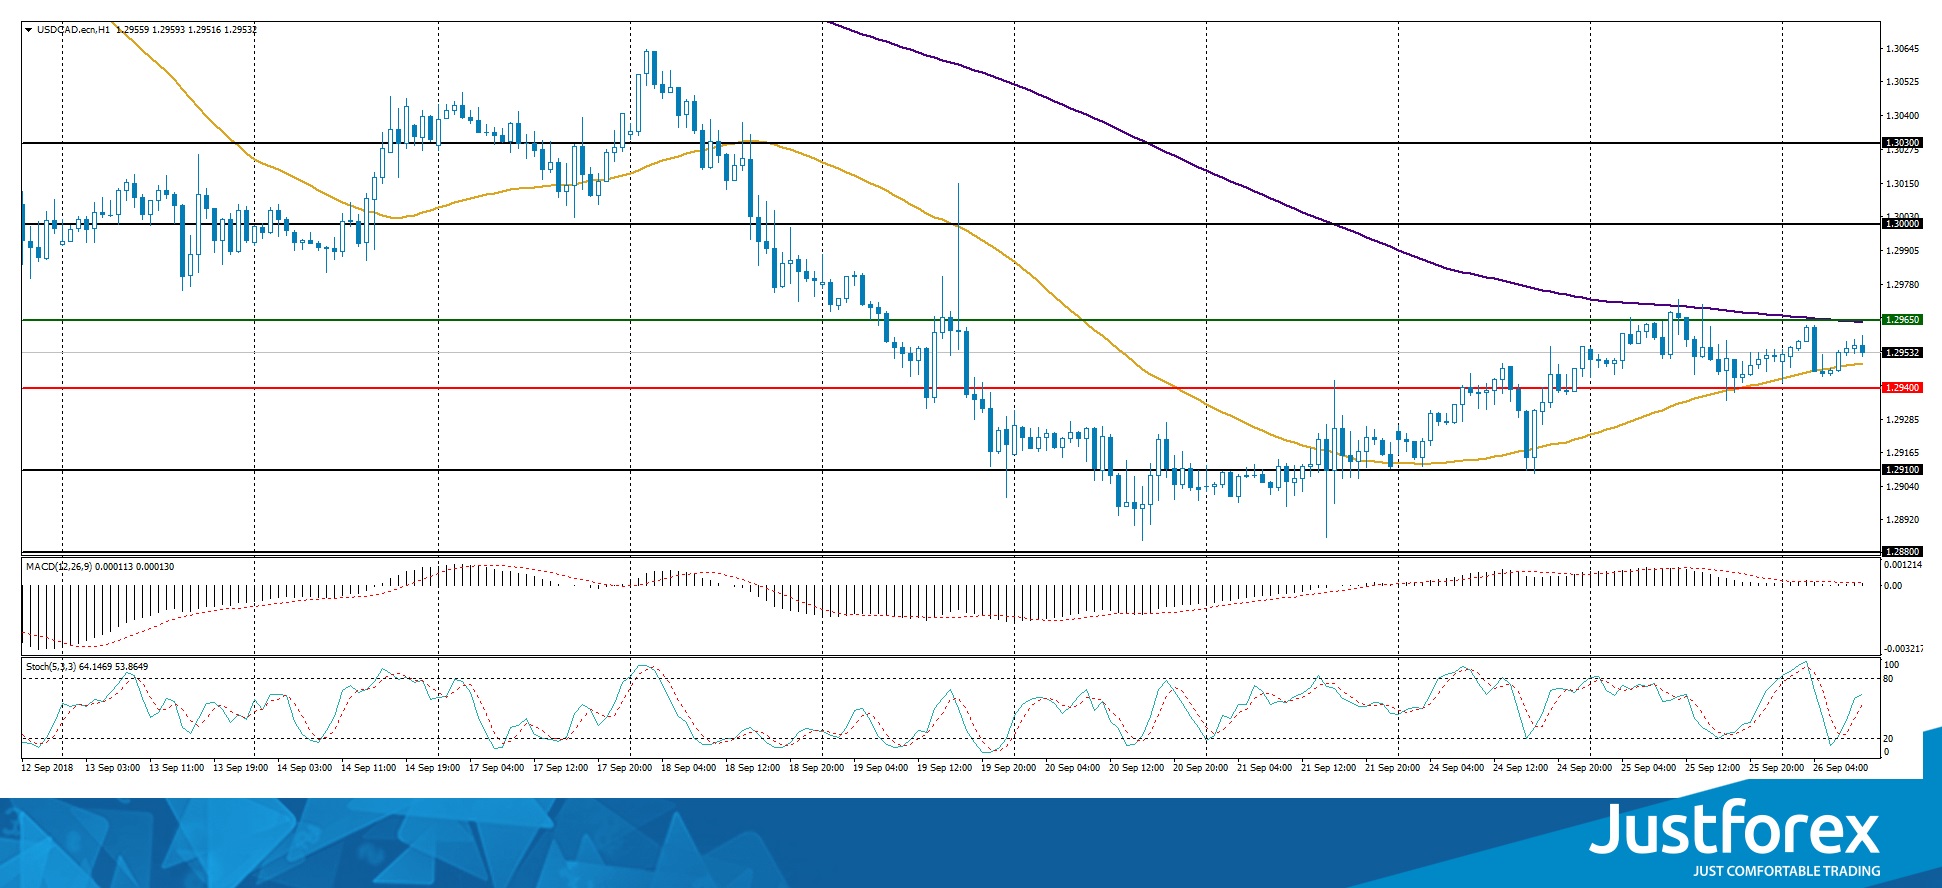
The price has fixed between 50 MA and 200 MA, which are strong dynamic support and resistance levels.
The MACD histogram is near the 0 mark.
Stochastic Oscillator is in the neutral zone, the %K line is above the %D line, which indicates the bullish sentiment.
Trading recommendations
Support levels: 1.29400, 1.29100, 1.28800
Resistance levels: 1.29650, 1.30000, 1.33000
If the price fixes below 1.29400, the USD/CAD quotes are expected to decline. The movement is tending to 1.29100-1.28800.
Alternative option. If the price fixes above the resistance of 1.29650, it is necessary to look for entry points to the market to open long positions. The target movement level is to 1.30000-1.30300.
The USD/JPY currency pair
Technical indicators of the currency pair:
Prev Open: 112.749
Open: 112.970
% chg. over the last day: +0.15
Day’s range: 112.751 – 112.912
52 wk range: 104.56 – 114.74
There is a variety of trends on the USD/JPY currency pair. At the moment, local support and resistance levels are 112.700 and 113.000, respectively. Investors expect the Fed decision on a key interest rate. We recommend paying attention to the US government bonds yield. Positions should be opened from the key levels.
The publication of important economic reports from Japan is not planned.
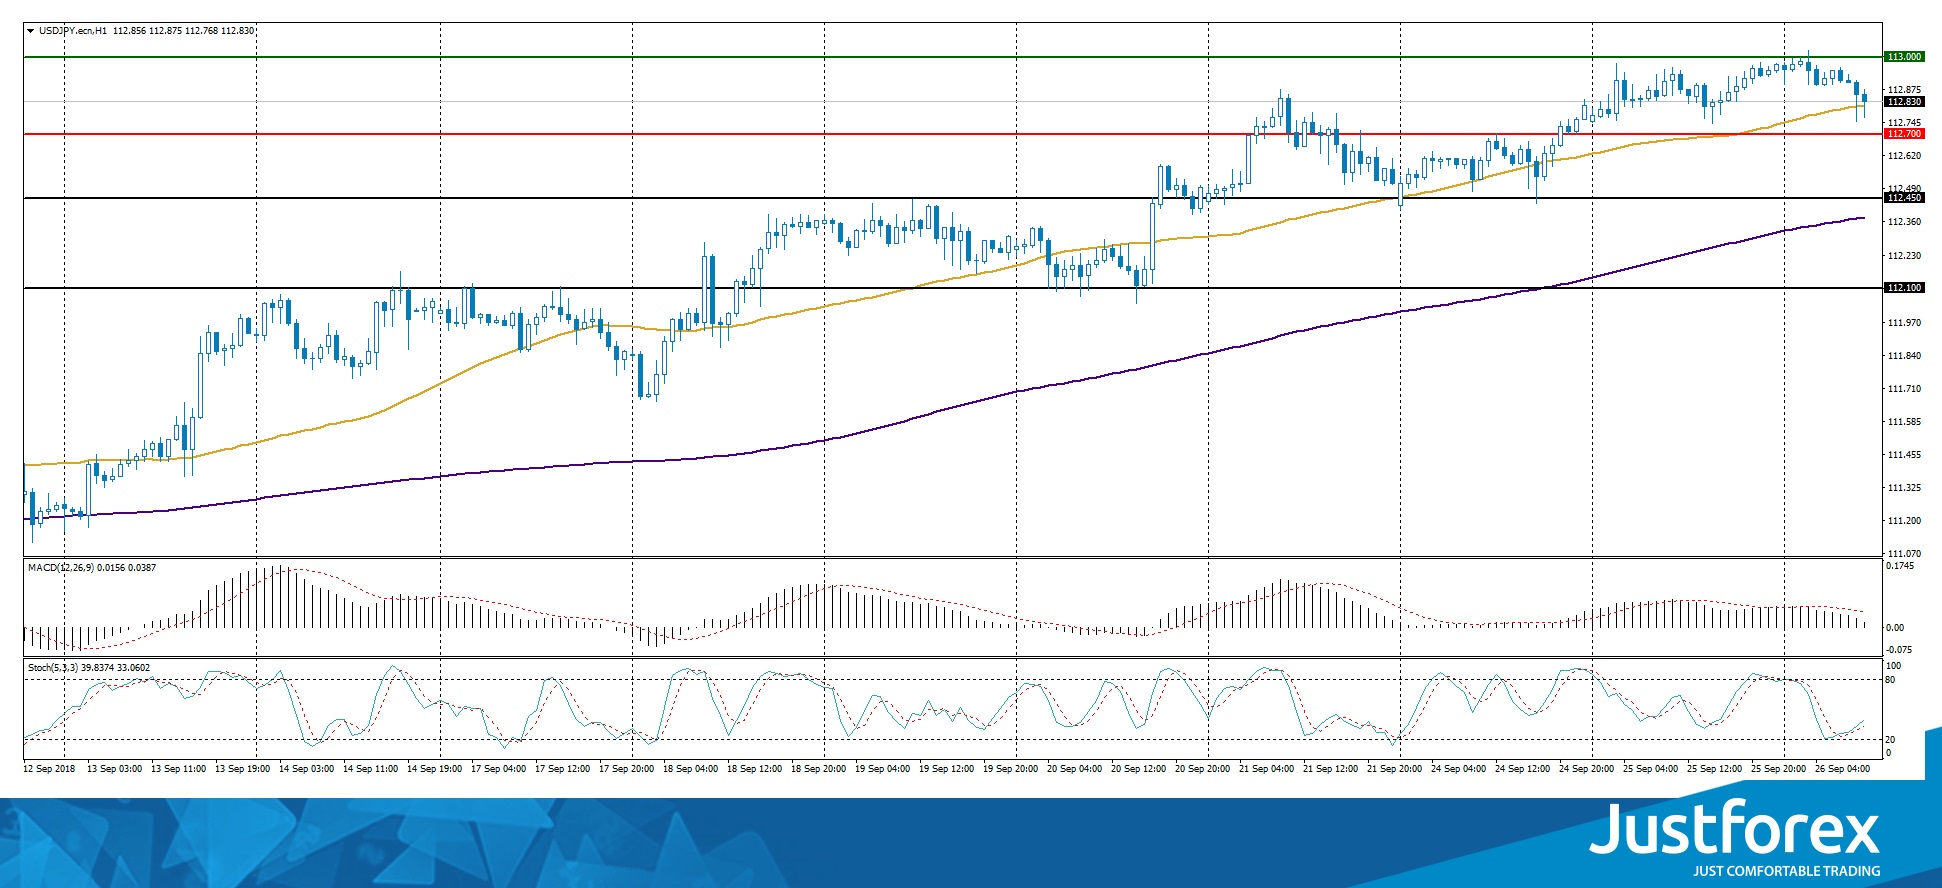
Indicators do not send accurate signals: the price is testing 50 MA.
The MACD histogram approached the 0 mark. There are no signals at the moment.
Stochastic Oscillator is in the neutral zone, the %K line is crossing the %D line. There are no accurate signals.
Trading recommendations
Support levels: 112.700, 112.450, 112.100
Resistance levels: 113.000, 113.500
If the price fixes above the round level of 113.000, the USD/JPY quotes are expected to rise. The movement is tending to 113.500-113.750.
An alternative may be the decrease of the USD/JPY currency pair to 112.450-112.100.


