
Facebook ticker symbol: $FB short-term Elliott wave view suggests that the decline to $158.26 low ended the cycle from 8/07/2018 peak in primary wave ((1)). The internals of that decline unfolded in 5 waves impulse structure with lesser degree cycles showing the sub-division of 5 waves structure in it’s each leg lower i.e intermediate wave (1),(3) & (5). Above from there, the stock is correcting the cycle from 8/07/2018 peak in primary wave ((2)) bounce.
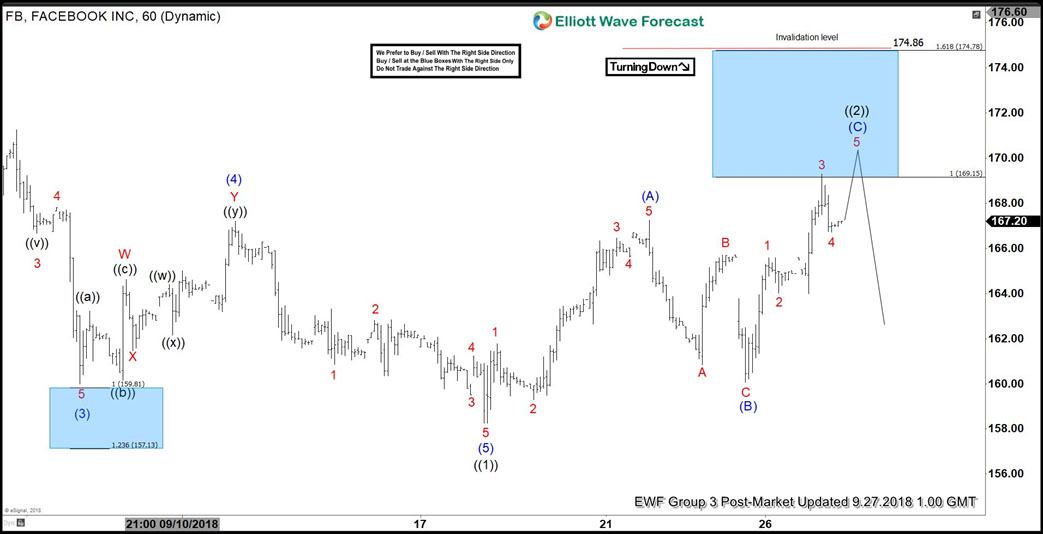
The internals of that bounce is unfolding as zigzag correction with the sub-division of 5-3-5 swing structure in lesser degree cycles i.e intermediate wave (A) & (C) unfolds in 5 waves and intermediate wave (B) unfolds in any 3 swings corrective sequence. Therefore, the initial rally to $167.25 high ended intermediate wave (A) in 5 waves structure. Where Minor wave 1 ended at $161.76, Minor wave 2 ended at $159.30. Minor wave 3 ended at $166.45 and Minor wave 4 ended at $165.61 low. Then finally, a move higher to $167.25 high ended Minor wave 5 & also completed intermediate wave (A) as well.
Down from there, the pullback $160.07 low ended intermediate wave (B). The internals of that decline also unfolded as zigzag where Minor wave A ended at $160.84. Minor wave B bounce ended at $165.70 and Minor wave C ended at $160.07 low. Up from there, the stock is rallying higher in intermediate wave (C). And already reached the blue box area at $169.15-$174.78 100%-161.8% Fibonacci extension area of (A)-(B). However, shorter cycles suggest another short-term high to take place within that area before getting rejected again looking for a primary wave ((3)) lower ideally or for 3 waves pull back at least. We don’t like buying it.
Facebook 1 Hour Elliott Wave Chart


