
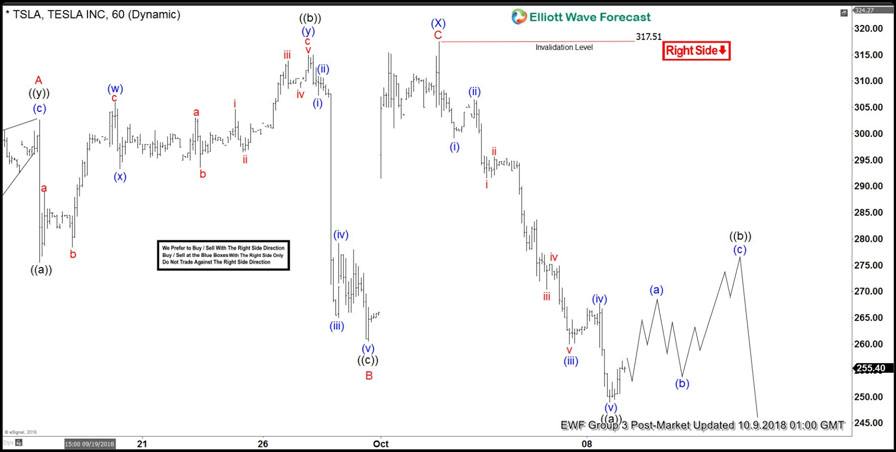
Tesla ticker symbol: $TSLA short-term Elliott wave view suggests that the rally to $317.51 high ended intermediate wave (X) bounce. The internals of that bounce unfolded as zigzag structure where Minor wave A ended in 5 waves at $302.64 high. Down from there, Minor wave B pullback ended as a Flat at $260.56 where lesser degree Minute wave ((a)) ended in swings at $275.50. Minute wave ((b)) ended in 3 swings at $315 high. And Minute wave ((c)) ended 5 waves decline at $260.56 low.
Up from $260.56 low, a rally to $317.51 high in 5 waves ended Minor wave C & also the intermediate wave (X). Down from there, Tesla has made a new low below 9/07/2018 low ($252.25) confirming the next extension lower in intermediate wave (Y) lower. Where initial decline to $249 low ended 5 waves in Minute wave ((a)) of a possible Zigzag structure. Above from there, the stock is doing a bounce in Minute wave ((b)) in 3, 7 or 11 swings. Near-term, while bounces fail below $317.51 high expect stock to fail for more downside. We don’t like buying it as the right side is lower & calling more downside against $317.51 high.
Tesla 1 Hour Elliott Wave Chart


 Favors the Bullish Side")


