
Key Highlights
- Crude oil price corrected lower and tested the $73.00 support area against the US dollar.
- There are two bullish trend lines in place with support at $73.30 and $72.40 on the 4-hours chart of XTI/USD.
- The NFIB Business Optimism Index in Sep 2018 declined from 108.8 to 107.9.
- The US Producer Price Index for Sep 2018 will be released today, which is forecasted to increase 0.2% (MoM).
Crude Oil Price Technical Analysis
After a major upward move, crude oil price found resistance near $77.00 against the US Dollar. The price started a downside correction and traded below the $75.00 and $74.00 support levels.
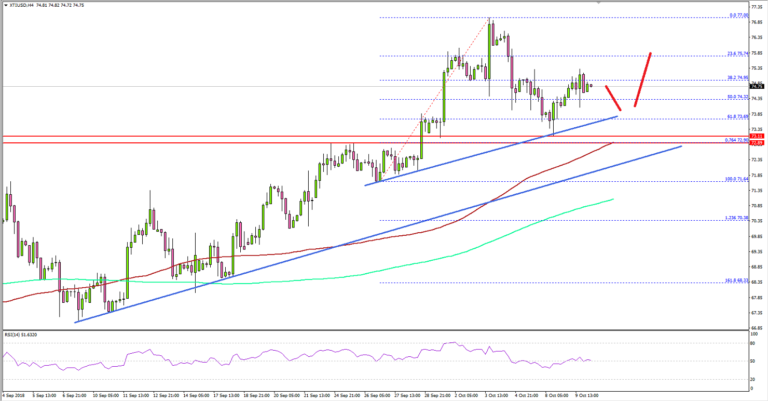
Looking at the 4-hours chart of XTI/USD, the price traded below the 61.8% Fib retracement level of the last wave from the $71.64 low to $77.00 high. However, the decline was protected by the $72.80-73.00 support area, which was a major resistance earlier.
The 76.4% Fib retracement level of the last wave from the $71.64 low to $77.00 high is also positioned near the $72.90 level. More importantly, there are two bullish trend lines in place with support at $73.30 and $72.40 on the same chart.
Below the first trend line, the 100 (red) simple moving average (4-hours) is positioned at $72.80. Therefore, there are many key supports near the $73.00, $72.90 and $72.80 levels. As long as the price is above these supports, it could resume its upside move towards $76.00.
On the other hand, if there is a downside break and close below $72.40 plus the 100 SMA, there may be an extended slide towards the $70.00 support area.
Looking at the major forex majors, EUR/USD declined sharply and traded below the 1.1460 support area. GBP/USD also struggled to clear the 1.3100-1.3110 resistance area.
Economic Releases to Watch Today
- UK GDP for August 2018 (MoM) – Forecast +0.1%, versus +0.3% previous.
- UK Industrial Production for August 2018 (MoM) – Forecast +0.1%, versus +0.1% previous.
- UK Manufacturing Production for August 2018 (MoM) – Forecast +0.1%, versus -0.2% previous.
- UK Trade Balance non-EU for August 2018 – Forecast £-3.1B, versus £-2.8B previous.
- UK Goods Trade Balance for August 2018 – Forecast £-10.90B, versus £-9.97B previous.
- US Wholesale Inventories for August 2018 – Forecast +0.8%, versus +0.8% previous.
- US Producer Price Index Sep 2018 (MoM) – Forecast +0.2%, versus -0.1% previous.
- US Producer Price Index Sep 2018 (YoY) – Forecast +2.8%, versus +2.8% previous.


 Elliott Wave: Incomplete Sequences Forecasting The Path")

