
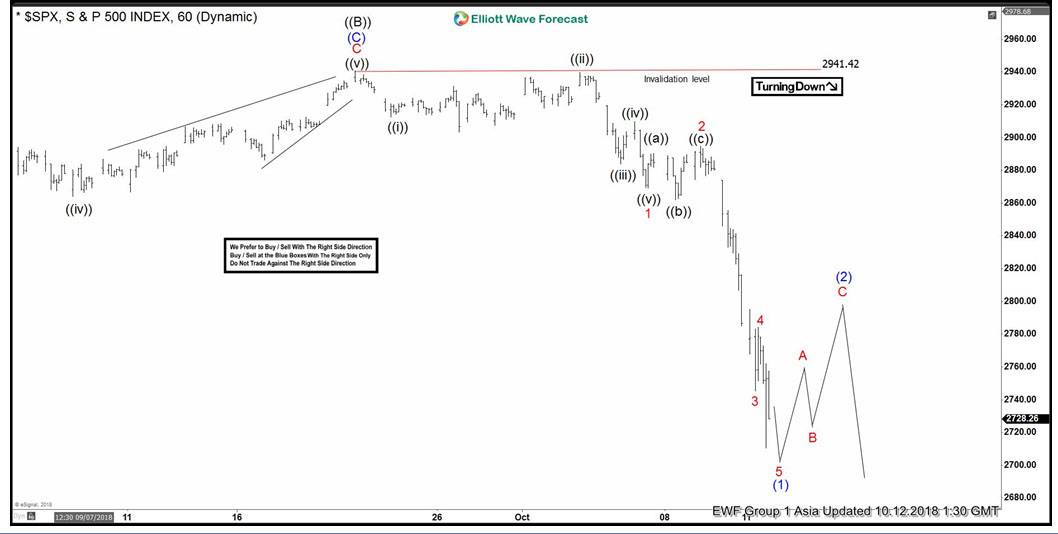
SPX short-term Elliott wave view suggests that a rally to $2941.42 high ended primary wave ((2)) bounce. Down from there, primary wave ((C)) remain in progress as impulse structure. Where initial decline to $2912.63 low ended Minute wave ((i)). A bounce to $2939.86 high ended Minute wave ((ii)). A decline to $2883.92 low ended Minute wave ((iii)), Minute wave ((iv)) ended at $2909.64.
Minute wave ((v)) ended at $2869.29 low, which also completed Minor Minor wave 1. Up from there a bounce to $2894.83 high ended Minor wave 2 as a Flat structure. Where lesser degree Minute wave ((a)) ended at $2890.42, Minute wave ((b)) ended at $2862.08 and Minute wave ((c)) ended at $2894.83. Down from there, Minor wave 3 ended in lesser degree 5 waves at $2745.46. A bounce to $2784.11 high ended Minor wave 4 recovery.
Currently, Minor wave 5 remain in progress looking to extend lower 1 more push towards $2711.82-$2667.16 100%-161.8% Fibonacci extension area of a Minor 5=1 target area to end intermediate wave (1) in 5 waves. Afterwards, the index is expected to do a bounce in intermediate wave (2) to correct the cycle from $2941.42 high in 3, 7 or 11 swings before turning lower 1 more time entering into another possible long side at $2584.87-$2363.19 area approximately. We don’t like selling it.
SPX 1 Hour Elliott Wave Chart


