
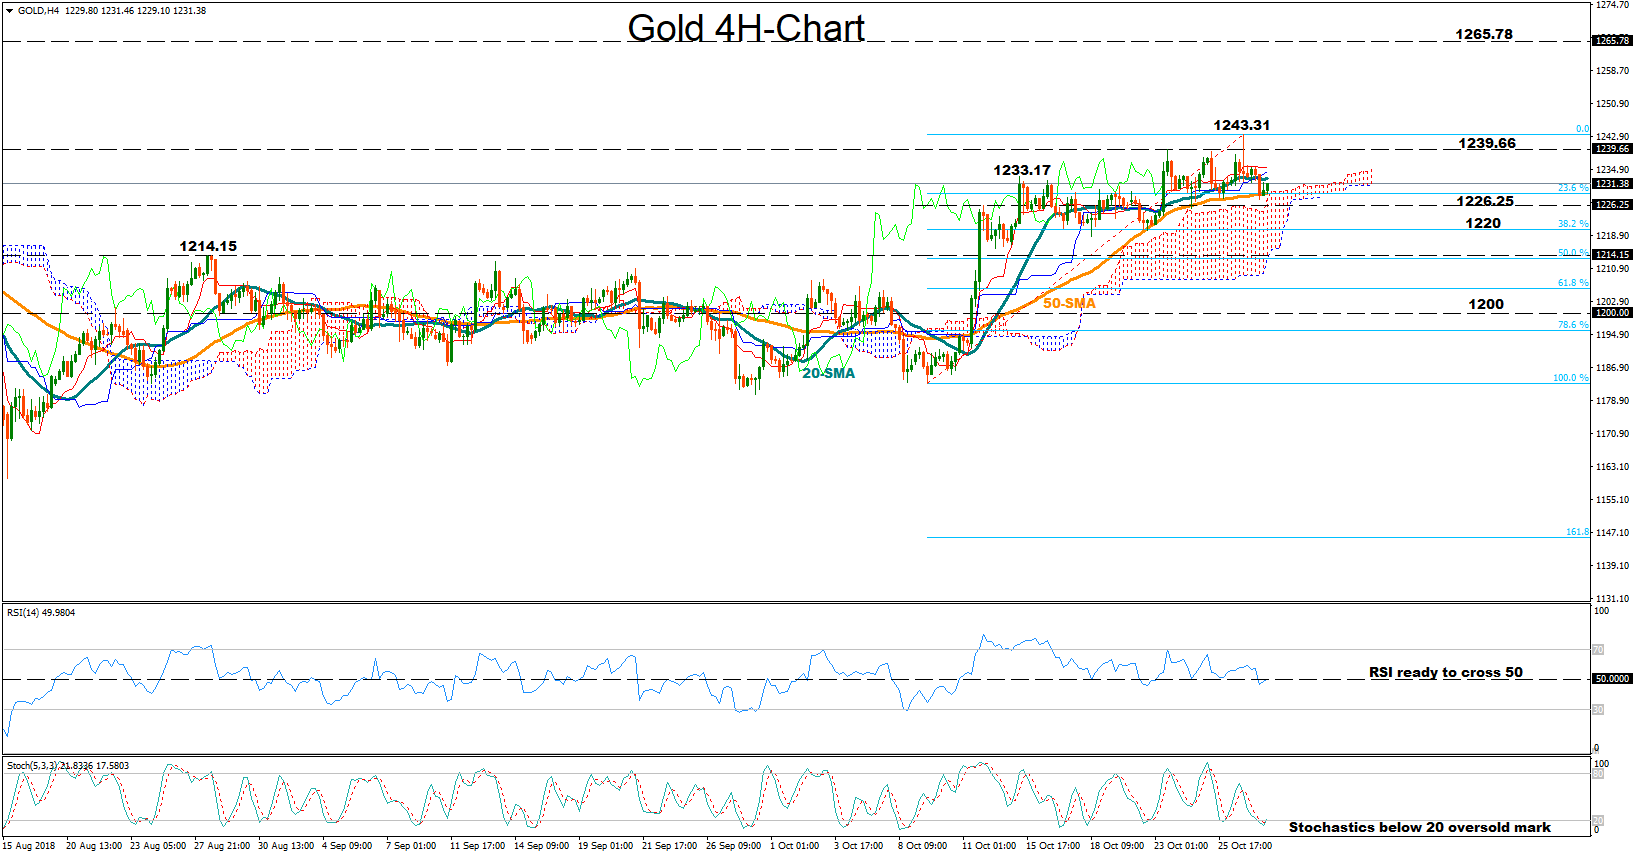
Gold is currently flirting with the 50-period moving average line in the four-hour chart after the pullback from the five-month high of 1243.31, a potential support area as the Stochastics are ready to post a bullish cross below 20 in oversold territory. The RSI though suggests that the market might trade in a range in the short-term as the indicator gains strength to cross back above 50.
A move higher and above October 15’s peak of 1233,17 would likely retest the area between 1239.66 and 1243.31. Should bulls overcome that region, the focus would probably turn to 1265.78 where upside movements paused in July and the 50% Fibonacci of the donwleg from 1365.11 to 1160 is located. Further up, the price might approach 1283 which acted both as support and resistance in the past, while if this fails to hold too, a stronger barrier is expected to come at 1300, the lower bound of the January-June range.
On the flip side, a fall below the 50-period SMA and particularly a cross below 1226.25, the October 11 high, would probably stop around 1220, the 38.2% Fibonacci of the downleg from 1183.14 to 1243.31. Lower than that, all eyes will shift to the 1214.15-1200 zone, which encapsulates previous tops, the 50% and the 61.8% Fibonacci.
Overall, the market looks neutral as long as it trade between 1214.15 and 1243.31.


 Is Testing an Important Resistance Zone")


