
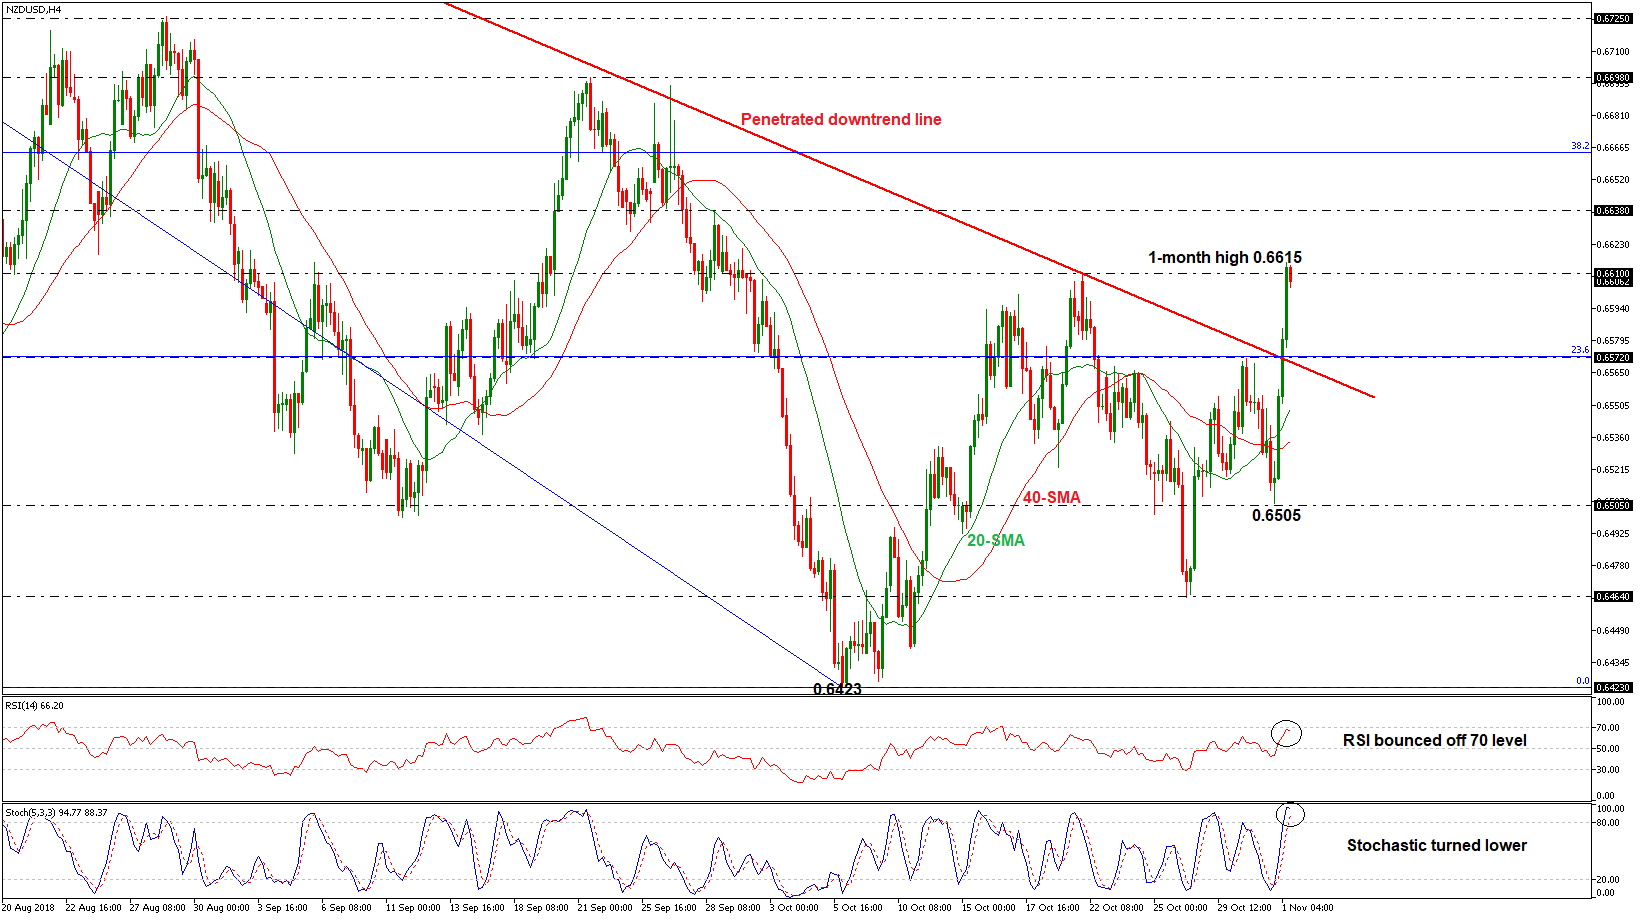
NZDUSD recorded a stunning rally over the last three sessions in the 4-hour chart, creating a new one-month high of 0.6615. Currently, though, the pair is on the backfoot and the technical indicators suggest that the market could ease a little bit in the short-term.
The RSI is moving marginally south after the bounce off the overbought levels, while the stochastic oscillator is showing signs for a potential retracement in price action. The Stochastics indicate that a pullback is not far off since the oscillators are in overbought levels. Still, this is more likely to happen if the blue % K line finally forms a bearish cross with the red %D line.
Should the market lose some ground after the sharp buying interest, support could be met at the 23.6% Fibonacci retracement level of the downleg from 0.7050 to 0.6423, around the 0.6572 barrier. A significant leg below this area could send prices towards the 20-simple moving average (SMA), which is currently fluctuating around 0.6550 before the market retests the 40-SMA of 0.6533. Then, if the market fails to hold above this level, the next stop could at the 0.6505 hurdle.
On the flip side, if the pair surpasses the intraday high, immediate resistance could be met at the 0.6638 barrier, taken from the high on September 28. Steeper increases could drive the price north towards the 38.2% Fibonacci region of 0.6665.
Looking at the bigger picture, NZDUSD penetrated to the upside of the medium-term descending trend line, which has been holding since June 6, changing the bearish outlook to neutral. More advances above 0.6700 could give signals for a steeper upside correction.


