
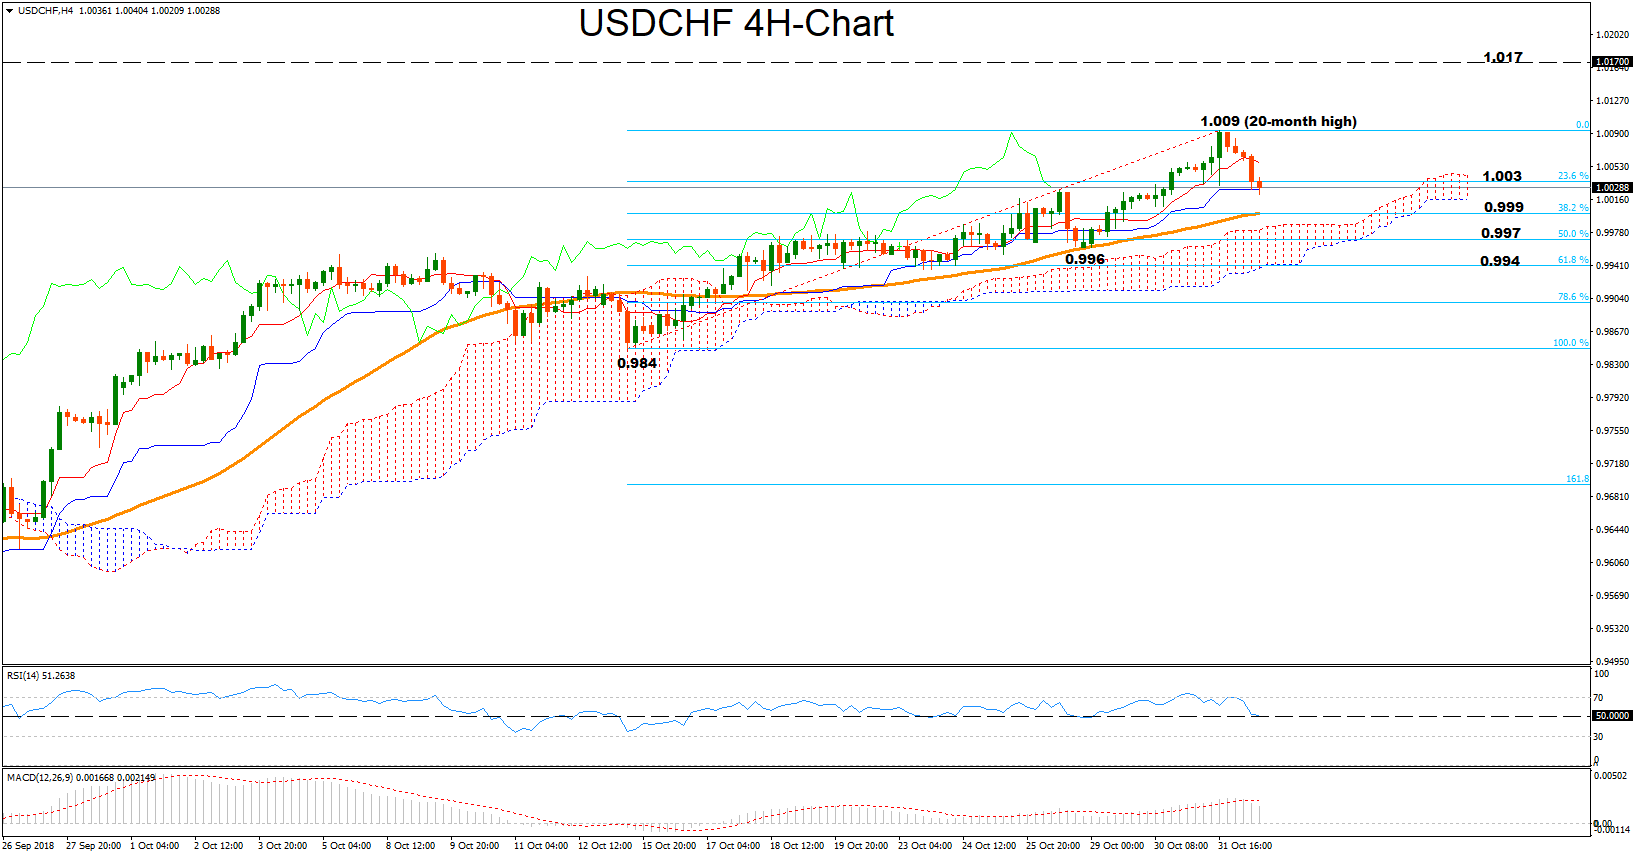
USDCHF topped at 1.009 on Wednesday, at the highest since March 2017, but with the RSI in the four-hour chart fluctuating near its 70 overbought threshold in the past couple of days, chances for a downside reversal were high and thus the price pulled back today. The indicator is currently a shy above its 50-neutral mark, signalling that the market might consolidate in the coming sessions. Yet the MACD continues to weaken below its red signal line, suggesting that weakness might persist.
Should the price head lower, immediate support could come in the crossroads of the 50-period moving average and the 38.2% Fibonacci of the upleg from 0.984 to 1.009, around 0.999. Note that the 50-period MA provided a significant support to downside movements on October 28, near 0.996 and slightly below the 50% Fibonacci. Beneath the 50% fibo, a stronger wall could be found around 0.994, which strictly restricted bearish and bullish corrections during October. A decisive close below that level would brush away any buying interest, turning the market into neutral again.
On the flip side, a rebound above the 23.6% Fibonacci of 1.003, could stretch until the 1.009 top. If this proves an easy obstacle, bullish actions may continue up to 1.017 the peak on March 2017. Even higher the door may open for the 1.024 resistance.


